
Jira Workflow Reporting Guide: From Scope to Export
Choose a Jira workflow question, population, metric, history window, validation method, saved report, and export format.
A reproducible Jira workflow report starts with one decision question, not a chart. Define the work item population, choose the metric that answers the question, set the history and calendar rules, validate representative items, and only then save or export the result. Recording those choices prevents two reasonable reports from being mistaken for contradictory evidence.
The seven-part reporting definition
Write these seven items before interpreting a number:
- Question: What decision will this report support?
- Population: Which Project, Filter, JQL, Sprint, or Epic is included?
- Selection time: Which Created, Updated, or Resolved dates select rows?
- History time: Is the full history calculated, or is Trim History applied?
- Metric: Duration, average, ownership time, entry date, or event count?
- Calendar: Elapsed time or a named working calendar and timezone?
- Output: Interactive review, saved setup, dashboard, CSV, or XLSX?
This workflow complements Jira’s native reports. Atlassian’s reports overview lists board and project reports such as Sprint Report, Control Chart, cumulative flow, and velocity. StatusPath Reports focuses on Jira history calculations by work item, status, assignee, and transition.
Match the question to the report type
| Question | StatusPath report | Main evidence |
|---|---|---|
| Where did each item spend time? | Time in Status | Duration by status and work item |
| Which group has the longest average Review time? | Average Time in Status | Average plus contributor count |
| How long was each historical owner recorded? | Time in Assignee | Duration by assignee |
| Which item revisited a status? | Status Count | Entry count by status |
| When did each item first reach a milestone? | Status Entry Date | First entry timestamp in the calculation window |
| Which exact movement repeated? | Transition Count | Directional transition count |
Read Report types documentation for the current product controls. For the duration formula itself, start with How to Calculate Time in Status in Jira Cloud.
When different Jira workflows use different detailed status names for the same analytical stage, keep the source columns visible and follow the status-group design and reconciliation method.
Choose a population before a metric
The same report type can answer different questions depending on its source:
| Source | Appropriate use | Important boundary |
|---|---|---|
| Project | Broad space-level review | Often too broad for a release decision |
| Saved Filter | Reuse a maintained Jira population | Filter ownership and changes matter |
| JQL | Define a precise auditable population | Validate the query in Jira |
| Sprint | Review one Jira Software sprint | Board and sprint identity matter |
| Epic | Analyze child work under one epic | Parent relationship and permissions apply |
Use the Project vs Filter vs JQL vs Sprint vs Epic decision Guide when ownership, reuse, audit evidence, or board dependency determines which source is defensible.
JQL is useful when the scope needs several rules. Atlassian’s JQL operator reference documents operators such as CHANGED and WAS; use them for population selection, not as a substitute for duration calculation.
Real Jira scenario: release readiness from question to evidence
A release manager wants to answer:
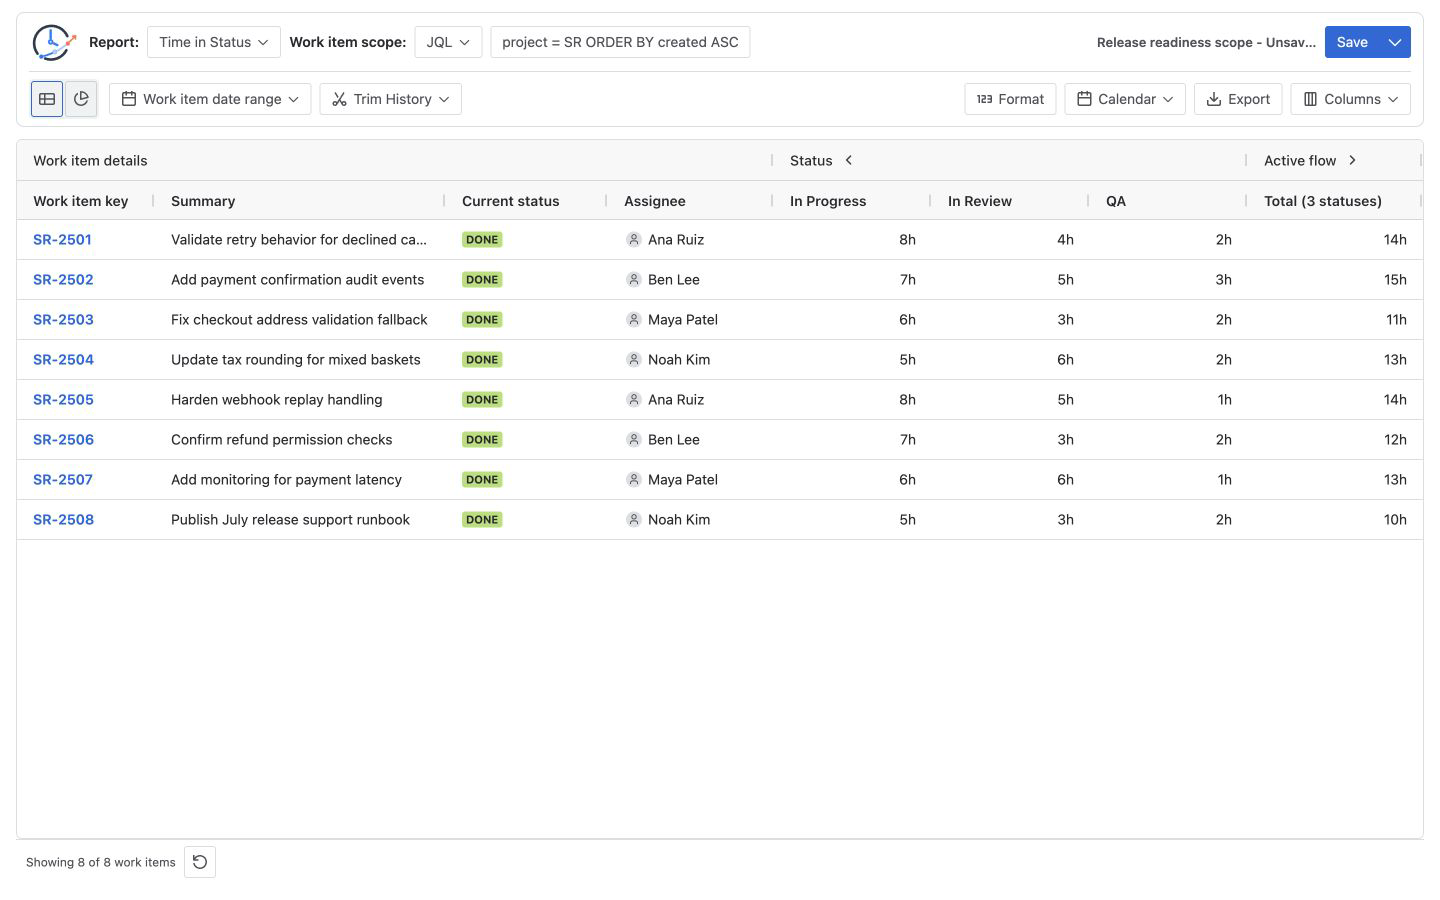
Which release items accumulated the most In Review or QA time, and what should be checked before the readiness meeting?
The team defines this configuration:
project = SR
AND fixVersion = "July Release"
ORDER BY created ASC- Report: Time in Status
- Selected columns: In Progress, In Review, QA
- History: full history
- Calendar: elapsed time
- Context fields: key, summary, current status, assignee
- Output: saved setup for reruns and XLSX for the meeting record
For SR-2501, the verified intervals are:
| Status | Duration |
|---|---|
| In Progress | 8h |
| In Review | 4h |
| QA | 2h |
| Total selected workflow time | 14h |
The 14-hour sum is useful only with its status breakdown and configuration. It does not identify root cause. The team still checks Jira History and the work item context.
Build the report in order
1. Write the decision question
“Find review delays before release approval” is testable. “Show workflow analytics” is not.
2. Configure the source
Select Project, Filter, JQL, Sprint, or Epic. Confirm a few expected and excluded work items before calculating metrics.
3. Separate row selection from history calculation
Work item date range selects rows using a Jira date field. Trim History changes the part of each selected item’s changelog that is calculated. Confusing the two is a common reason reports disagree.
4. Choose report, fields, and columns
Keep only fields that help interpret the question. Dynamic status, assignee, or transition columns depend on the selected data and calculation window.
5. Validate representative rows
Check at least one normal row, one high-value row, and one blank or zero-looking row against Jira History. For count analysis, use the method in the rework guide.
6. Save the configuration or export the result
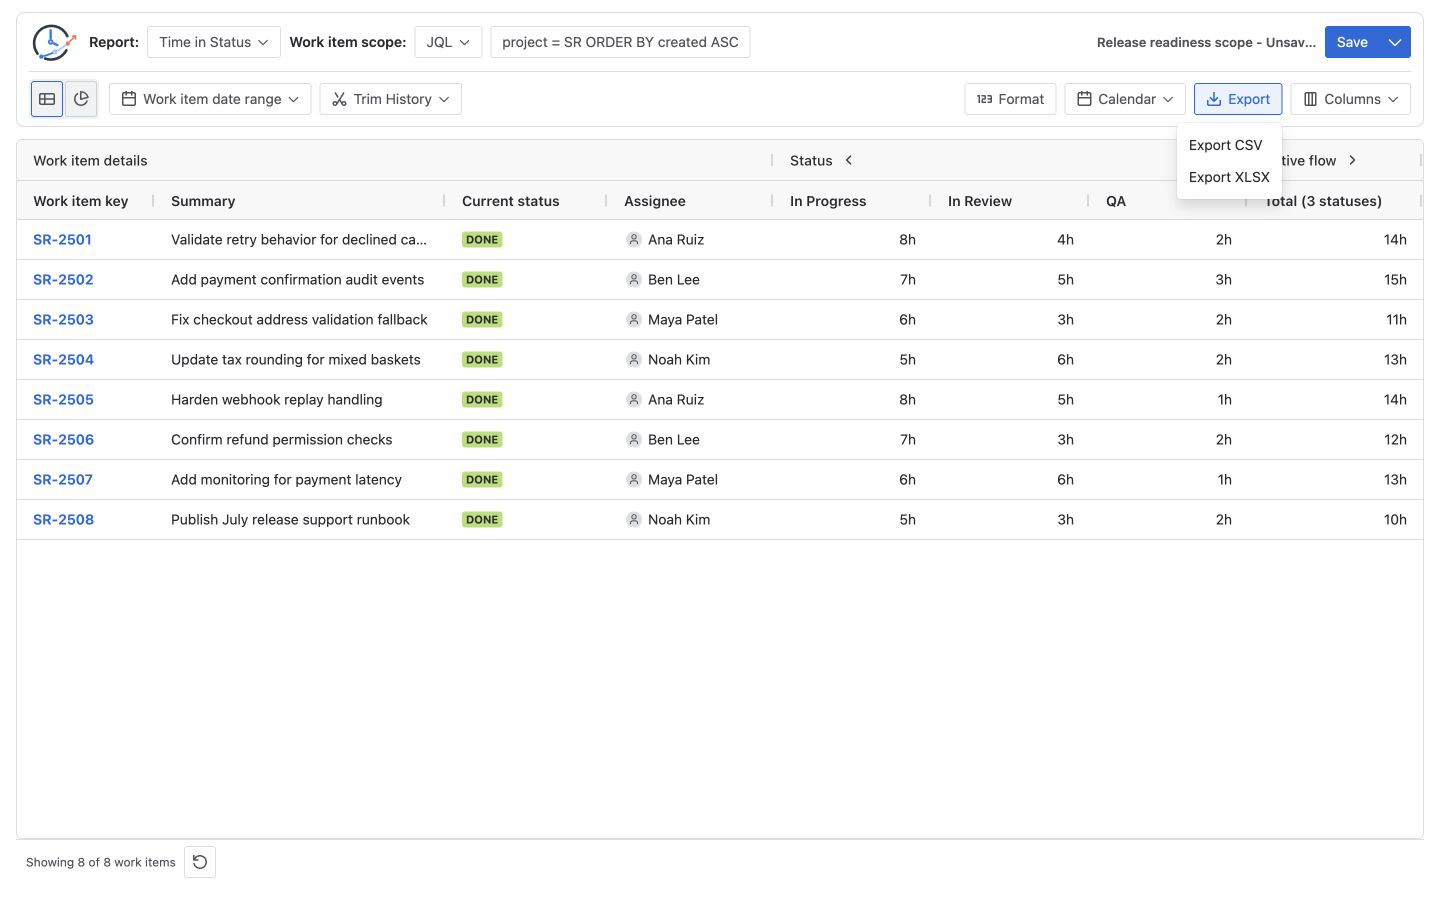
Saved Reports store reusable configuration, not a frozen Jira dataset. CSV and XLSX store output from a run. Read Saved Reports, the reusable-report operating Guide, and Export before choosing the artifact.
Native Jira reports and StatusPath answer different layers
- Atlassian’s Sprint Report documentation applies to company-managed spaces and says the report is board-specific and includes work items matching the board’s saved filter. It is designed for sprint scope and completion review; see the Sprint workflow analysis guide for the full retrospective sequence.
- Atlassian’s Control Chart calculates cycle time from selected workflow columns and shows variation, rolling average, and outliers.
- Jira dashboards can host gadgets; Atlassian’s gadget instructions cover adding and editing them.
- Jira’s native CSV export guidance covers exporting Jira search fields. A StatusPath export is different: it includes calculated status, assignee, date, or transition columns from the configured report.
Do not describe one layer as replacing the other. Use Jira-native reports for their documented board and project questions, and use history-derived tables when you need per-item calculated evidence.
Common mistakes
Starting with a chart instead of a decision
A visually interesting chart can still use the wrong population or history window. Define the question first.
Treating Work item date range as Trim History
The first selects items; the second clips the history used for calculation.
Comparing different calendars
Elapsed and business time are different metric definitions. Name the calendar and timezone in shared evidence.
Saving a report and expecting frozen values
A Saved Report reruns its setup against current Jira data and permissions. Export when a point-in-time file is required.
Confusing native CSV with calculated report export
Jira field export and StatusPath calculated columns are not the same artifact. Record which one you used.
Frequently asked questions
Which Jira workflow report should I start with?
Start with Time in Status for row-level waiting, Average Time in Status for group comparison, Time in Assignee for ownership, Status Count for repeated stages, Status Entry Date for milestones, and Transition Count for exact movements.
Should I use JQL or a saved filter?
Use a saved filter when a team already maintains the population. Use JQL when the report needs a self-contained query. In either case, record who owns the selection rule.
What should be checked manually?
Verify representative rows against Jira History, confirm the source population, review date and Trim History settings, and confirm the calendar and timezone.
Is an exported spreadsheet a live report?
No. It is output from one run. Jira data can change afterward.
Can I place the report on a Jira dashboard?
StatusPath Reports includes a Dashboard Gadget for compact dashboard use. Use the main report page for full building, validation, saving, and export.
Related Guides
- How to Create a Jira Time in Status Report with JQL
- How to Calculate Time in Status in Jira Cloud
- How to Find Jira Workflow Bottlenecks
- How Is Average Time in Status Calculated in Jira?
- How to Measure Jira Rework with Status Count and Transition Count
- How to Measure Time by Assignee in Jira
- Jira Sprint Workflow Analysis: Time in Status, Rework, and Trends
- How to Export Jira Time in Status to Excel
- How to Find the Date a Jira Work Item Entered a Status
- Average vs Total Time in Status in Jira
- Jira Transition Direction Report Template
- Jira Workflow Review Checklist
- Weekly Jira Workflow Report Example for Management
Make every reported number reproducible
A reliable workflow report keeps the question, population, selection window, history window, metric, calendar, and output together. StatusPath Reports provides six history-derived report types, five sources, validation-ready tables, Saved Reports, dashboards, and CSV/XLSX export so teams can preserve that definition from analysis through review.
Try StatusPath Reports on the Atlassian Marketplace and reproduce one decision question with a documented configuration.