
Report Types
This page explains each report type available in the main StatusPath Reports page and when to use it.
All report types use the same setup pattern: choose a Work item scope, optionally filter the work item date range, optionally trim history, then review the table or chart result.
How to choose a report type
Start with the question you need to answer.
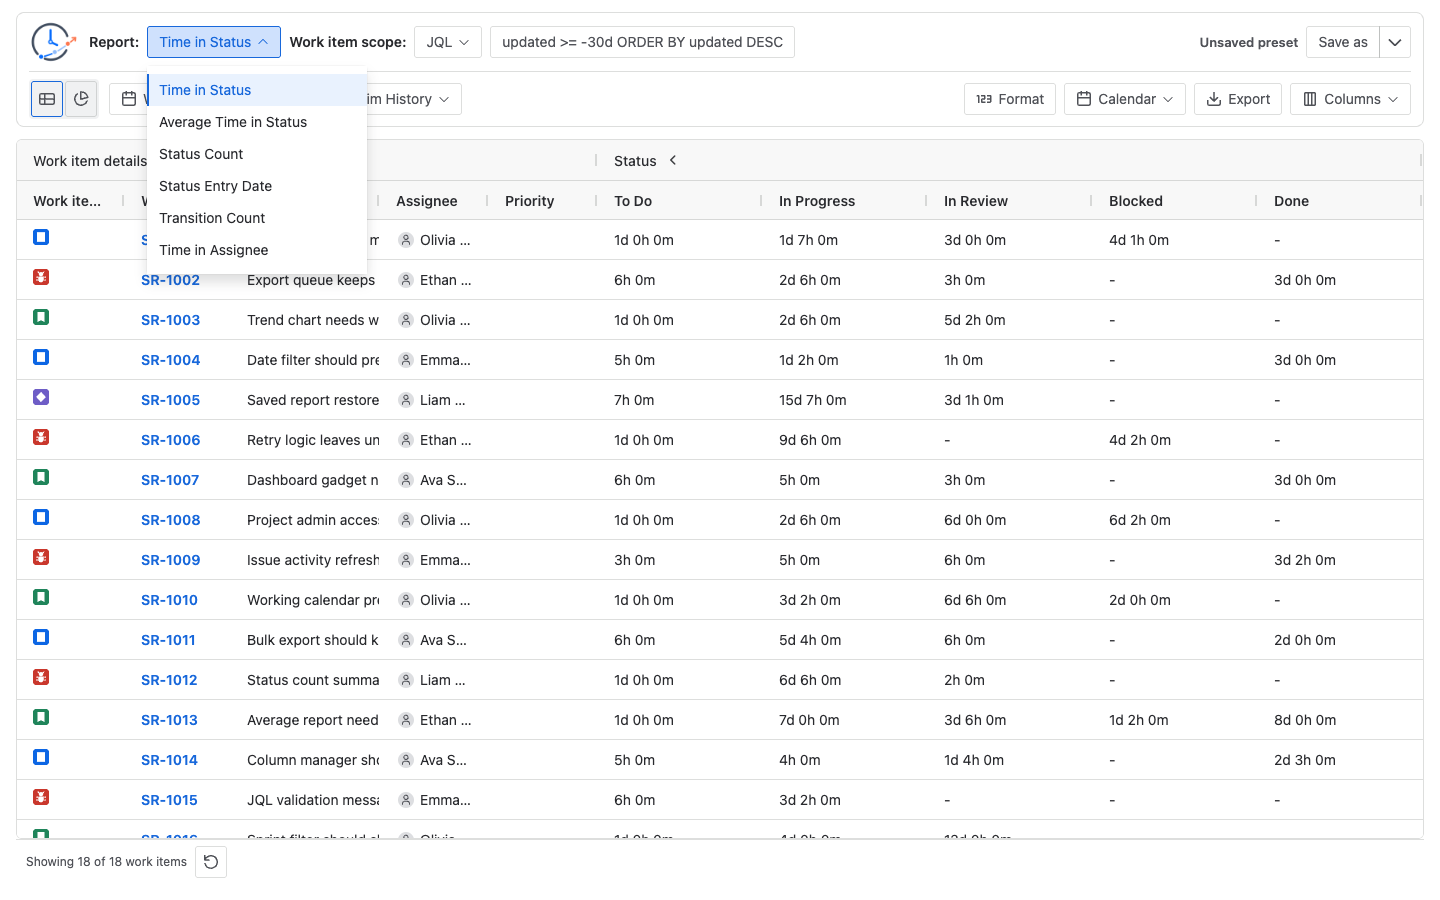
| Report type | Best for | Main output | Typical question |
|---|---|---|---|
| Time in Status | Finding where individual work items spend time. | One row per work item with duration by status. | Which work items spent the longest time in In Review or Blocked? |
| Average Time in Status | Comparing average status time by group or time period. | Grouped rows with average duration columns. | Which day, project, assignee, or field value has the longest average In Progress time? |
| Time in Assignee | Reviewing ownership and handoffs. | One row per work item with duration by assignee. | Who held this work item, and for how long? |
| Status Count | Finding repeated status entries. | One row per work item with counts by status. | Which work items entered Blocked or In Review more than once? |
| Status Entry Date | Checking milestone timing. | One row per work item with first entry date by status in the calculated history window. | When did each work item first reach Done? |
| Transition Count | Finding workflow churn. | One row per work item with counts by transition. | Which work items moved back and forth between statuses? |
The result changes when the selected work items or calculated history window changes.
Time in Status
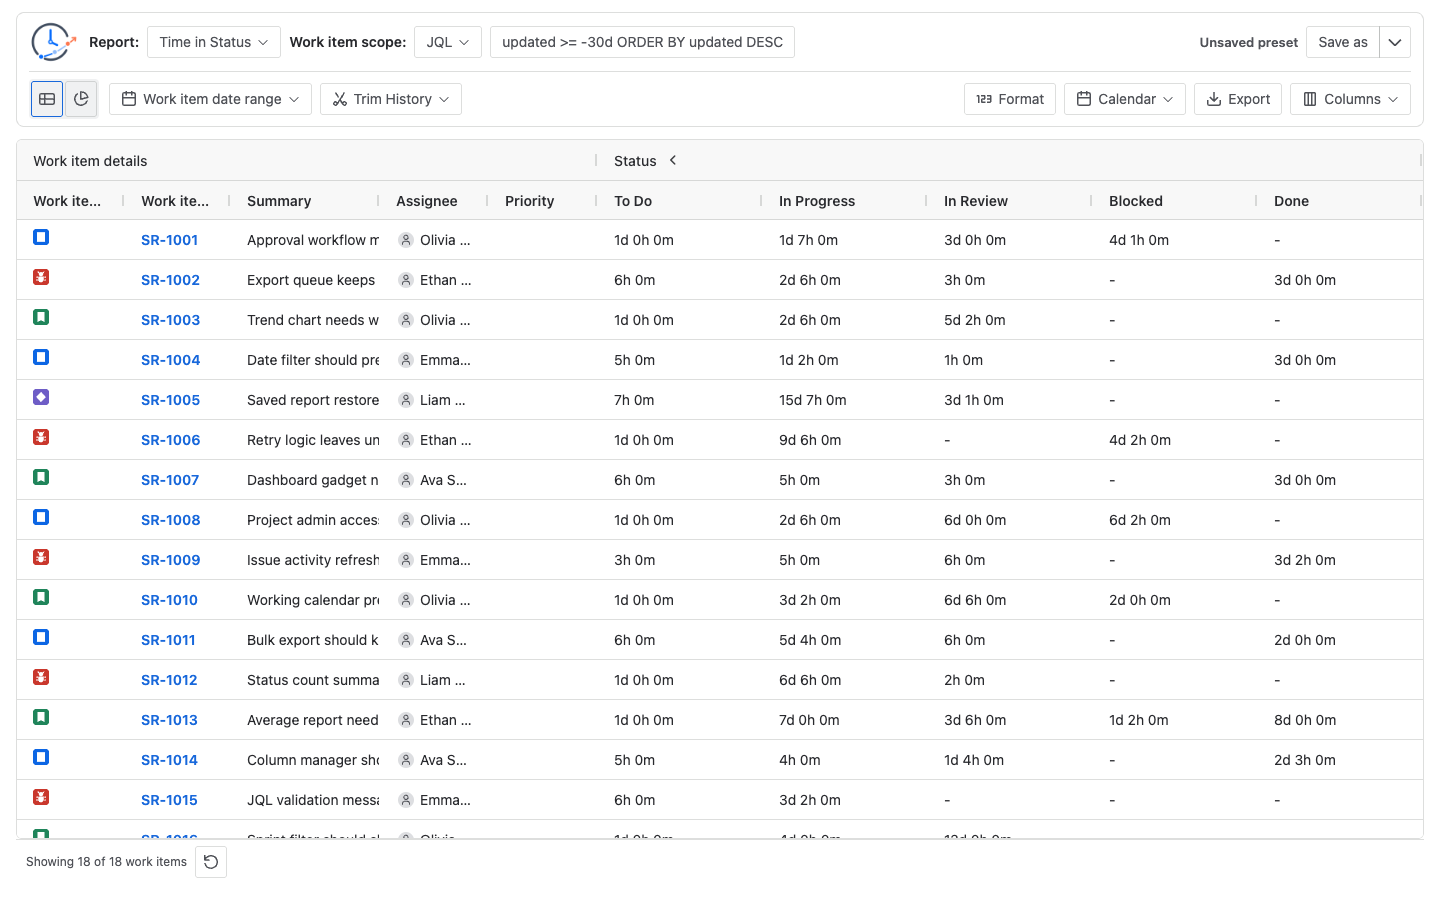
Time in Status shows how long each work item stayed in each workflow status during the calculated history window.
When to use it
Use Time in Status when you want to inspect individual work items and find where work is waiting.
It is a good starting point for questions such as:
- Which work items are spending too long in review?
- Which work items were blocked?
- Which status is the main bottleneck for a specific set of work?
- Which work items have unusual total status time?
How to read the result
Read across a row to see how one work item moved through statuses. Read down a status column to compare work items in the same status.
Duration values use the selected Format and Calendar controls. If a duration looks unexpectedly small, check Trim History first. Trim History can exclude older or newer history from the calculation.
Average Time in Status
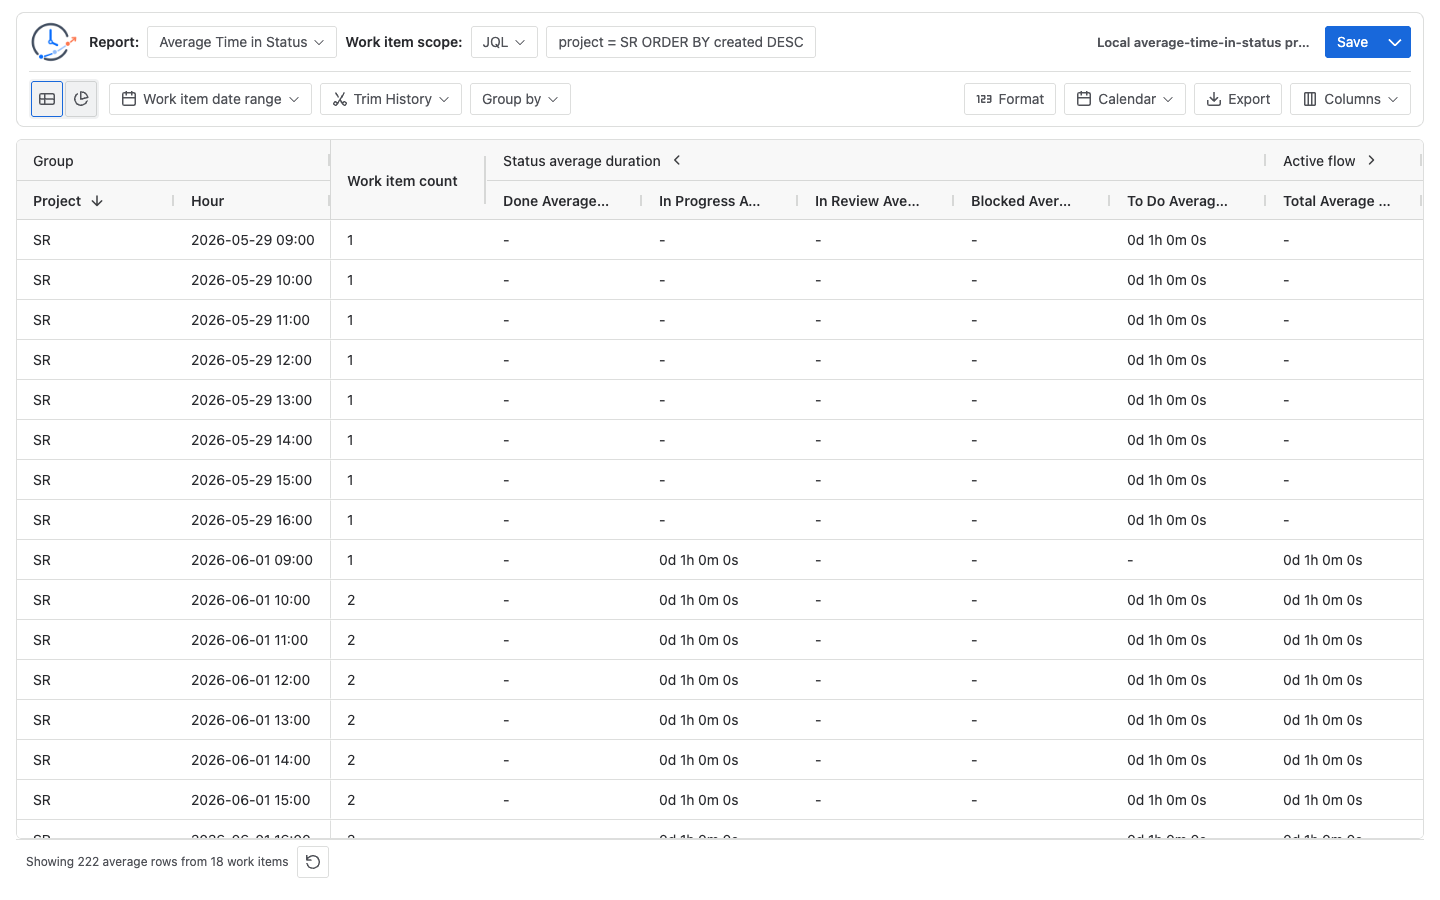
Average Time in Status groups work items and shows average duration by status for each group.
When to use it
Use Average Time in Status when individual rows are too detailed and you need a comparison across groups or periods.
It is useful for questions such as:
- Which day or week had the longest average review time?
- Which project, assignee, priority, or work item type is slowest?
- Did a process change reduce average time in a status?
- Which group has the highest average blocked time?
How to read the result
Read each row as a group, not a single work item. The work item count tells you how many distinct work items participated in that group. In version 2.5, it is displayed as count (percentage of the report population) and opens the participating-work-item table in Report Center.
The row count is not necessarily the denominator for every status average: a work item participates in a status average only when it has a qualifying contribution to that status. Multi-value Group by fields can also put one work item in more than one row, so row percentages can add to more than 100%. Use Issue drill-down and Work item status journey to trace the aggregate to its items and interpret these boundaries.
If a group has too few work items, treat the average cautiously. A single long-running work item can make a small group look worse than the rest.
Use the average-versus-total Time in Status guide to reconcile grouped averages with row-level totals from the same work items.
For the exact status-specific denominator, repeated-entry rule, blank-versus-zero behavior, and worked example, see How to Calculate Average Time in Status in Jira Cloud.
If a grouped average changes while no work item transitions, How an Open Current-Status Interval Changes Average Time in Status shows how an open interval can move the numerator while the contributor count remains fixed.
Time in Assignee
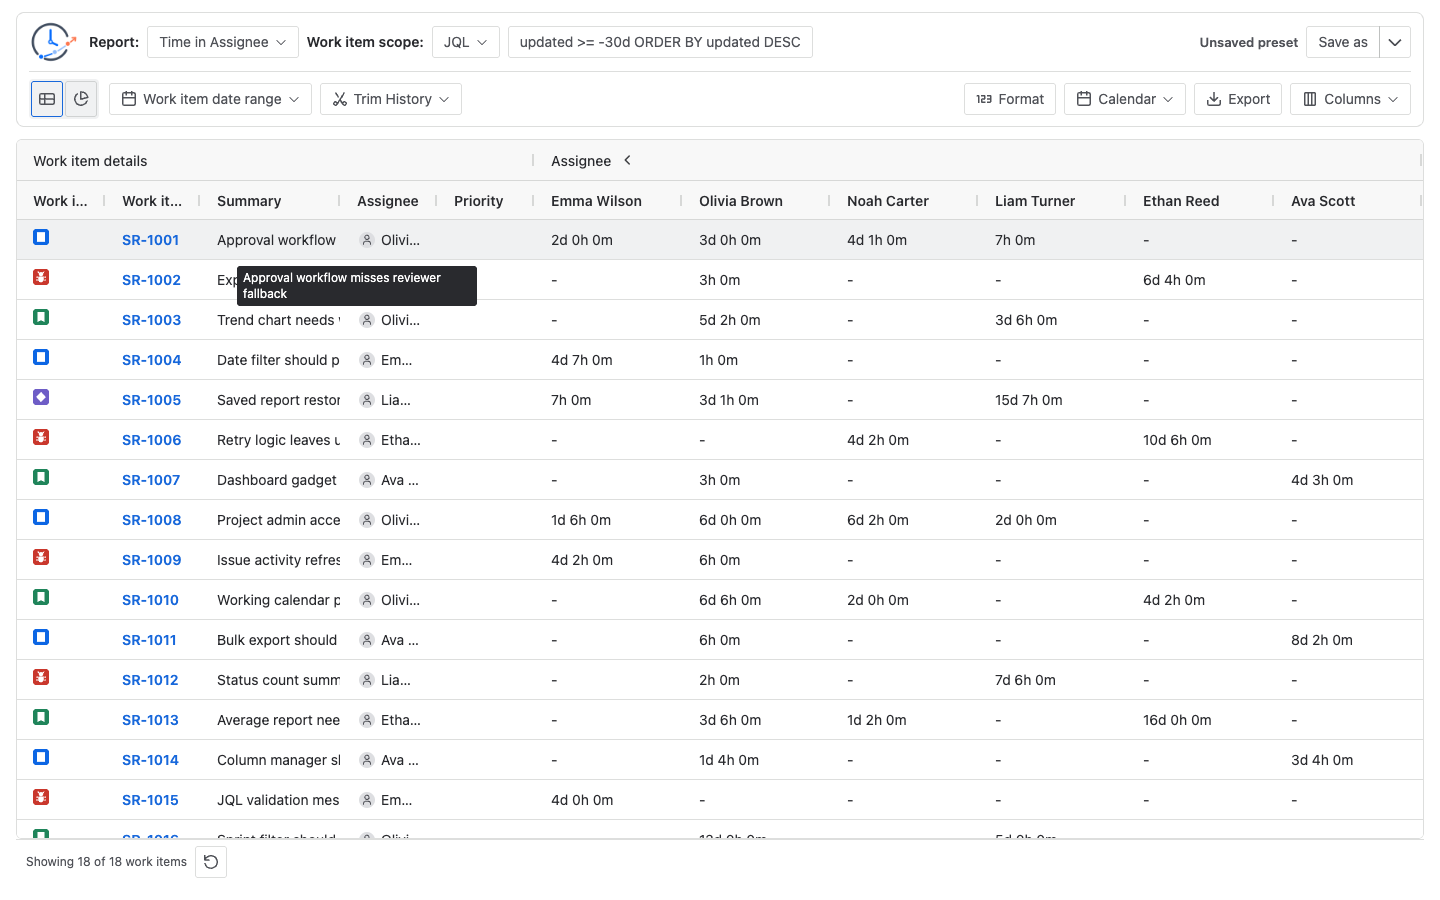
Time in Assignee shows how long each work item stayed assigned to each assignee during the calculated history window.
When to use it
Use Time in Assignee when you need to understand ownership, handoffs, and waiting time by person or unassigned state.
It is useful for questions such as:
- Which work items waited longest with one assignee?
- How often did work move between people?
- Which work items spent time unassigned?
- Did ownership handoffs add delay?
How to read the result
Read across a row to see where one work item spent assignee time. Read down an assignee column to compare work items for the same assignee.
The current assignee field in the work item details tells you the current Jira assignee. The assignee duration columns summarize historical assignment time and can include people who are no longer assigned.
Status Count
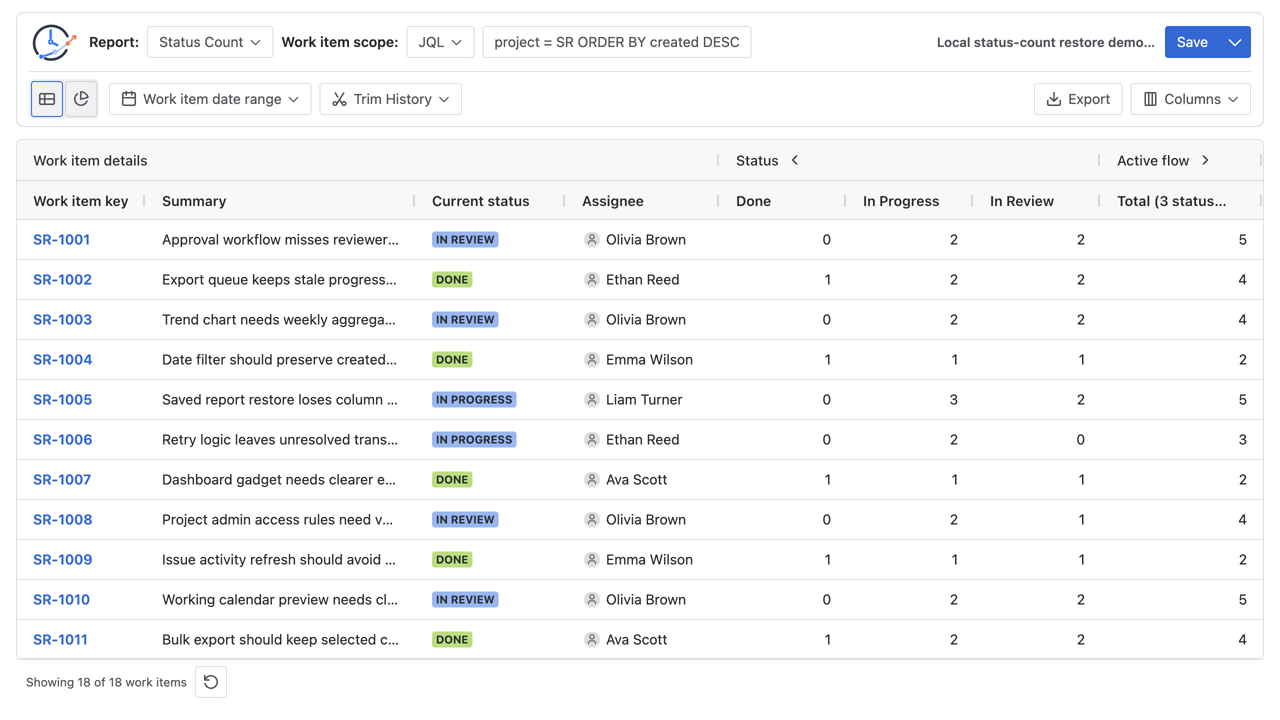
Status Count shows how many times each work item entered each status during the calculated history window.
When to use it
Use Status Count when you want to find repeated status entries, repeated reviews, or repeated blocking that may warrant a rework investigation.
It is useful for questions such as:
- Which work items entered Blocked more than once?
- Which work items went through review repeatedly?
- Which statuses show repeated entries that should be checked against the team’s rework definition?
- Which work items have unusually high status entry counts?
How to read the result
Higher counts mean the work item entered that status multiple times in the calculated history window. When a status column is present, 0 means that work item has no counted entry for the status in the current calculation window. A dynamic status column may be omitted when no row has a value for it unless the column is explicitly selected.
Status Count is a signal, not an automatic rework classification. Apply a written team definition and verify representative work items and transition directions in Jira History.
Status Count does not use duration Format or Calendar controls because the output is numeric counts.
Status Entry Date
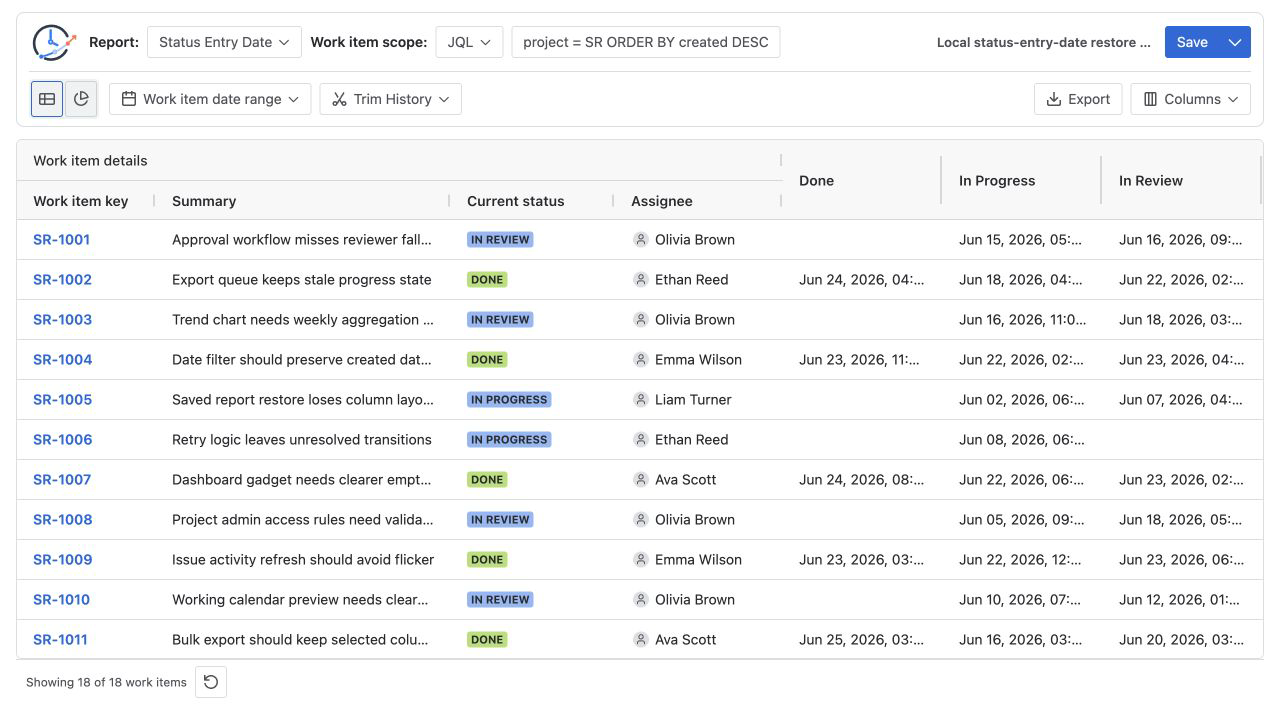
Status Entry Date shows the first date and time each work item entered each status in the calculated history window. It does not provide a latest-entry or every-entry report mode.
When to use it
Use Status Entry Date when the timing of a milestone matters more than duration.
It is useful for questions such as:
- When did each work item first reach In Review?
- When did each work item first reach Done?
- Which work items reached a key status during a release window?
- Which work items have not reached a required status?
How to read the result
Read a status column as the first entry date for that status within the current calculation window. If the cell is blank, the report did not find an entry for that status in the calculated history window.
Trim History matters. If Trim History starts after a work item first entered a status, the visible entry date can reflect the first entry inside the trimmed window rather than the earliest entry in the full Jira history.
Transition Count
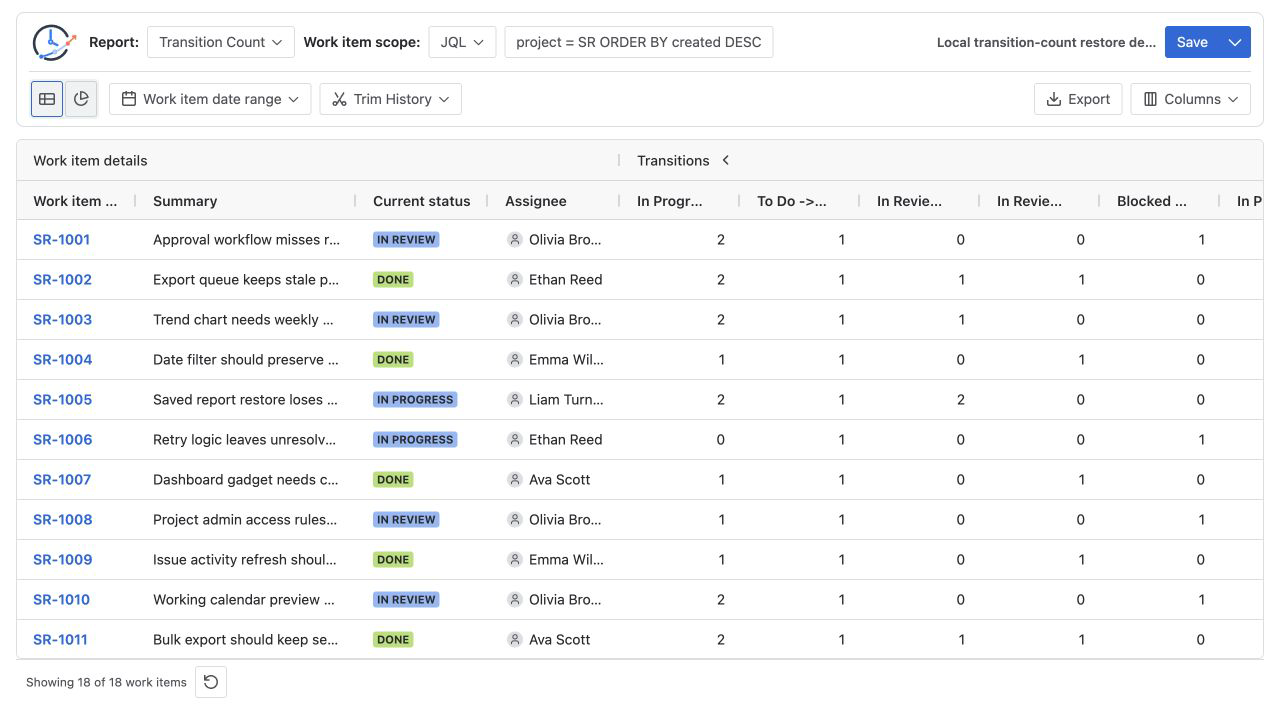
Transition Count shows how many times each work item moved from one status to another status during the calculated history window.
When to use it
Use Transition Count when you want to find workflow churn, loops, or repeated back-and-forth movement.
It is useful for questions such as:
- Which work items moved from In Review back to In Progress?
- Which work items repeatedly entered and left Blocked?
- Which transitions happen most often in this data set?
- Which work items have unusual workflow movement?
How to read the result
Read each transition column as a count of that specific from-status to to-status movement. The total transition value summarizes counted transitions for the visible report result.
When a transition column is present, 0 means that work item has no matching transition in the calculated history window. Transition columns depend on the transitions present in the selected work items and history window. If a transition does not occur anywhere in the current data, its dynamic column may be omitted unless it is explicitly selected.
Use the Jira transition direction report template to document the exact from-status → to-status pairs, inclusion rules, validation samples, and owners behind a reusable Transition Count report.
Chart support
Chart view can summarize report data when the selected report and current result provide enough chartable values.
Time in Status has dedicated chart options such as Top Bottleneck and Status Time Trend. Average Time in Status, Time in Assignee, Status Count, Status Entry Date, and Transition Count use shared trend-style chart behavior. If a chart is empty or hard to interpret, switch back to Table and confirm that the report has enough matching rows and columns.
Common empty result reasons
- The selected Work item scope returns no work items.
- The current Jira user cannot view matching work items.
- Work item date range filters out the selected work items.
- Trim History removes the relevant status, assignee, or transition history.
- The selected report needs history that the selected work items do not have.
- A chart has too little chartable data even though the table has rows.