
Average vs Total Time in Status in Jira
Compare total and average Jira status time with a nine-item Review example, Work item type grouping, outlier checks, and matched StatusPath reports.
Total time in a Jira status adds the durations contributed by every matching work item. Average time in that status divides the same total by the number of contributing work items. Nine Review durations of 1h, 2h, 2h, 3h, 4h, 3h, 5h, 6h, and 10h total 36h and average 4h. Use the total for accumulated load and the average for per-item comparison.
Total Review time   = sum of the Review durations
Average Review time = Total Review time ÷ Review contributors
The same history, two different questions
Total and average are two aggregations of the same duration rows. They are not interchangeable:
| Measure | Calculation | Question it answers | What it can hide |
|---|---|---|---|
| Per-item status duration | One work item’s status intervals added together | How long did this work item spend in Review? | The population-wide load |
| Population status total | The Review values for all matching work items added together | How much Review time accumulated across this population? | Whether the load was spread evenly |
| Status average | Population status total divided by Review contributors | How much Review time did a contributing work item have on average? | The distribution and outliers |
In StatusPath Reports, Time in Status supplies the work-item rows used for the first two questions. Average Time in Status supplies aggregate arithmetic means. The 36-hour population total in this guide is an explicit sum of the Review column; it is not a separate report type.
If the uncertain part is who belongs in the divisor, read how Average Time in Status handles contributors and skipped statuses. This page keeps all nine work items as Review contributors and focuses on total-versus-average interpretation.
Real Jira scenario: one long review changes the mean
The controlled StatusPath Reports (SR) Jira project contains nine completed work items: four Stories, three Bugs, and two Tasks. All timestamps are UTC, and the report uses a configured 24×7 Calendar named All time (UTC) with Decimal Hours. The project and work-item data are for this reproducible demonstration; the named Calendar is not a promised default for every installation.
| Work item | Type | Entered In Review | Entered Done | Counted Review time |
|---|---|---|---|---|
| SR-4101 | Story | 2026-07-08 12:00 | 2026-07-08 13:00 | 1h |
| SR-4102 | Bug | 2026-07-08 15:00 | 2026-07-08 17:00 | 2h |
| SR-4103 | Task | 2026-07-08 13:00 | 2026-07-08 15:00 | 2h |
| SR-4104 | Story | 2026-07-08 16:00 | 2026-07-08 19:00 | 3h |
| SR-4105 | Bug | 2026-07-08 14:00 | 2026-07-08 18:00 | 4h |
| SR-4106 | Task | 2026-07-08 16:00 | 2026-07-08 19:00 | 3h |
| SR-4107 | Story | 2026-07-08 16:00 | 2026-07-08 21:00 | 5h |
| SR-4108 | Bug | 2026-07-08 18:00 | 2026-07-09 00:00 | 6h |
| SR-4109 | Story | 2026-07-08 12:00 | 2026-07-08 22:00 | 10h |
The 10 hours for SR-4109 are reproducible under the selected calendar:
2026-07-08 22:00 - 2026-07-08 12:00 = 10hAtlassian explains that the History filter in a Jira work item’s Activity section records updates such as field edits and movement through the workflow. Use that history to verify these transition timestamps before interpreting a duration report: What are the different types of activity on a work item?
Manually check the total, average, and outlier share
Start with the nine visible Review values:
Total Review time = 1h + 2h + 2h + 3h + 4h + 3h + 5h + 6h + 10h = 36h
Contributor count = 9
Average Review time = 36h ÷ 9 = 4h
The arithmetic reconciles because the same nine raw durations and the same contributor rule are used on both sides. Before formatting, the identity is:
Total = Average × Contributor count
36h   = 4h × 9
The detail rows also reveal why “4 hours is normal” would be too strong. SR-4109 contributes 10 of the 36 hours:
Outlier share of Review total = 10h ÷ 36h = 27.78%
Average without SR-4109       = 26h ÷ 8 = 3.25h
The grouped rows require a second reconciliation:
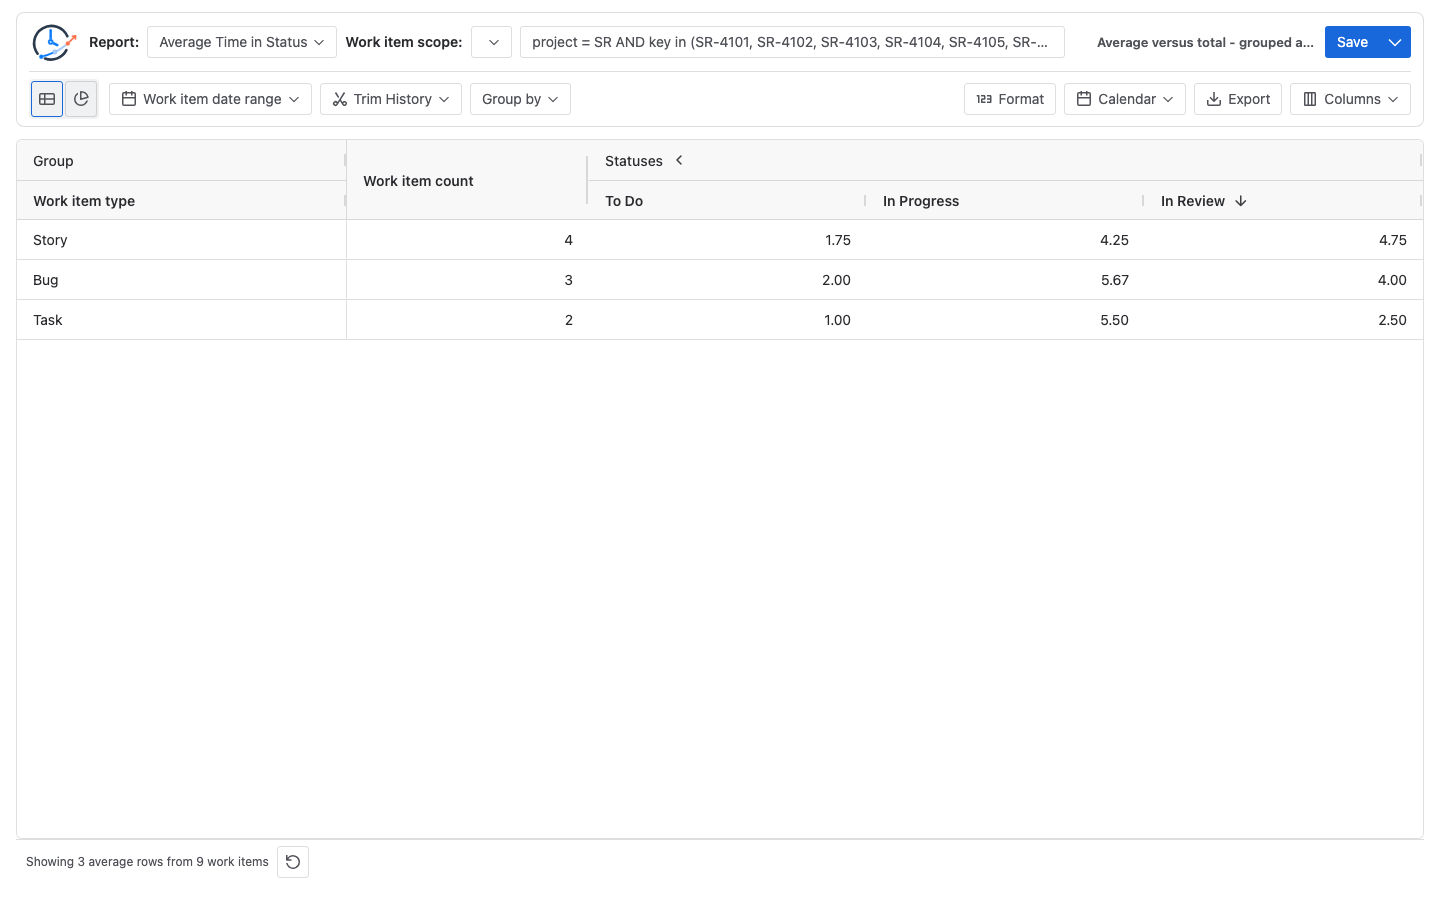
Story = (1h + 3h + 5h + 10h) ÷ 4 = 19h ÷ 4 = 4.75h
Bug   = (2h + 4h + 6h) ÷ 3       = 12h ÷ 3 = 4.00h
Task  = (2h + 3h) ÷ 2            =  5h ÷ 2 = 2.50h
Simple mean of group averages     = (4.75h + 4.00h + 2.50h) ÷ 3 = 3.75h
Weighted overall average          = (3 × 4.00h + 4 × 4.75h + 2 × 2.50h) ÷ 9 = 36h ÷ 9 = 4.00h
The overall average is mathematically correct, but one long item moves it from 3.25h to 4h. Investigate that item’s Jira history before treating the mean as a process baseline. The grouped values also show why an unweighted average of displayed group averages is not the population average.
Atlassian’s Control Chart documentation likewise emphasizes variation and outliers. The native Control Chart maps cycle or lead time across selected statuses and shows an average, rolling average, and standard deviation for company-managed spaces. That configured cycle-time metric is not automatically the same as this guide’s sum or average of one Review status.
Reproduce the comparison in StatusPath Reports
1. Hold the population constant
Use one Project, Filter, JQL, Sprint, or Epic source for both reports. For this scenario, use:
project = SR AND key in (SR-4101, SR-4102, SR-4103, SR-4104, SR-4105, SR-4106, SR-4107, SR-4108, SR-4109) ORDER BY key ASCAtlassian’s advanced search documentation describes JQL as a way to specify precise criteria and confirms that ORDER BY controls result order.
2. Hold the calculation settings constant
Use the same Work item date range, Trim History, Calendar, timezone, and Format. For this check:
- Do not apply a Work item date range or Trim History.
- Select the configured 24×7 All time (UTC) Calendar.
- Select Decimal Hours.
Changing any of those settings between the two runs changes the inputs, so the results no longer form a clean reconciliation. See Report setup and scope and Calendars and duration for the control boundaries.
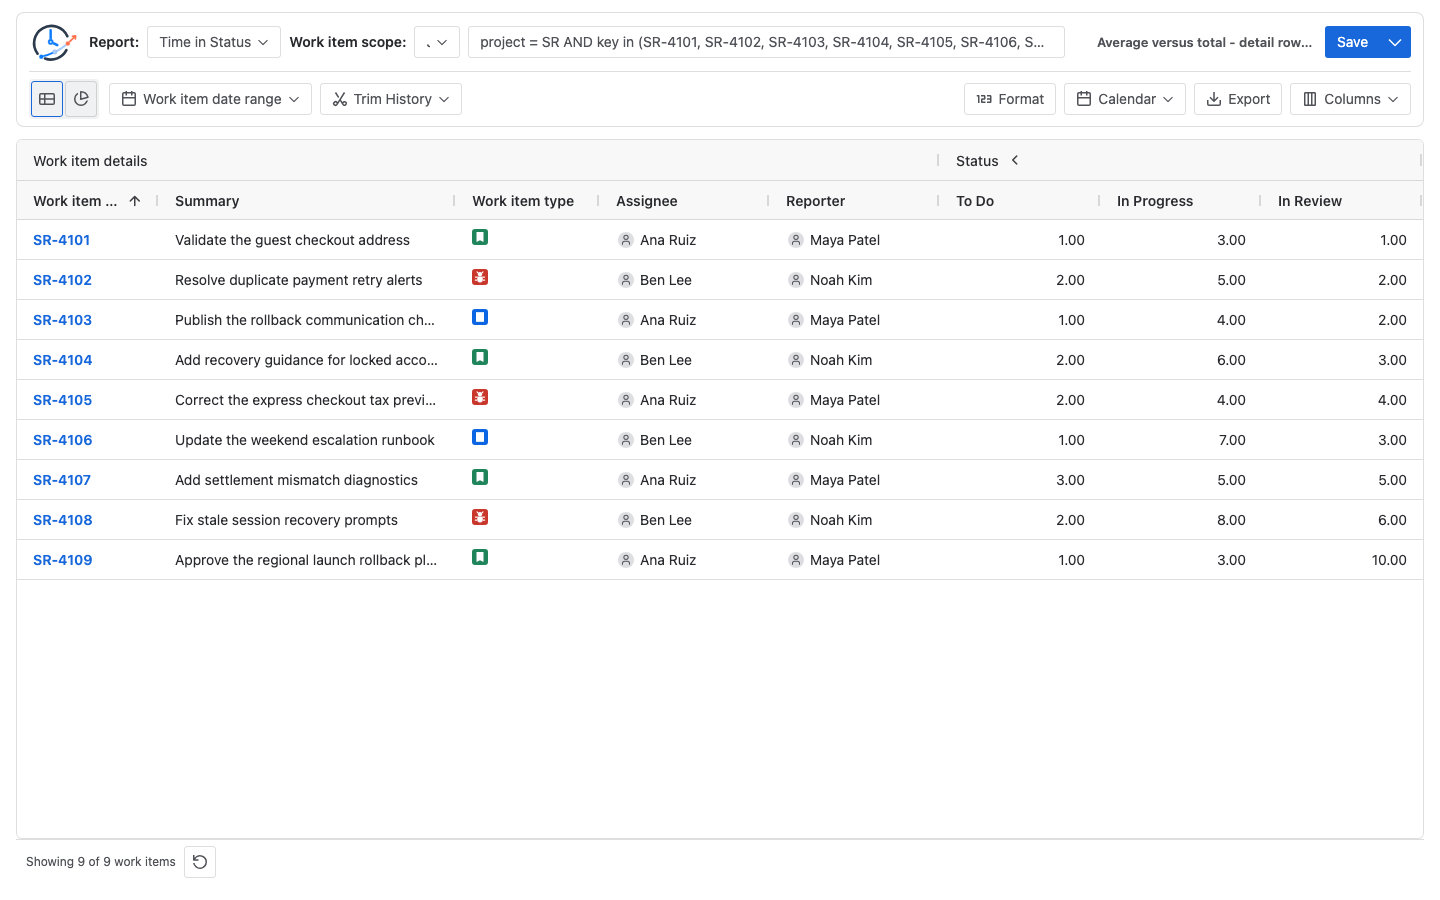
3. Run Time in Status first
Keep Work item key, Work item type, Summary, and In Review visible. Verify that the nine Review cells are 1h, 2h, 2h, 3h, 4h, 3h, 5h, 6h, and 10h, then add that one status column to get 36h. Do not add each row’s Total column: that value combines visible status durations for one work item and answers a different question.
4. Run Average Time in Status on the same scope
Switch only the report type, set Group by to Work item type, and keep In Review visible. The three rows should show Bug with three work items at 4.00h, Story with four at 4.75h, and Task with two at 2.50h. Reconstruct the overall average as the weighted 36h ÷ 9 = 4h; do not use the simple 3.75h mean of the three displayed averages. Clear Group by only when one overall row is needed. The current Report types documentation explains that Time in Status uses one row per work item, while Average Time in Status uses aggregate rows with average status-duration columns.
5. Return to the detail for interpretation
If the mean looks surprising, sort the In Review column from longest to shortest or export the detail rows for reconciliation. In this scenario, SR-4109 explains 27.78% of the total Review time.
Choose the metric from the decision you need to make
| Decision | Start with | Then verify |
|---|---|---|
| Find the work item consuming the most Review time | Time in Status, sorted by In Review | Jira History for the leading rows |
| Estimate accumulated Review load in a fixed population | Sum the Time in Status Review column | Scope, calendar, history window, and missing contributors |
| Compare mean Review duration between groups or periods | Average Time in Status | Contributor count and matching configuration |
| Decide whether a mean represents most items | Time in Status distribution | Outliers, median or percentile analysis outside the mean |
Total grows with both volume and duration. Average normalizes by contributor count but remains sensitive to extreme values. A team can have a larger total with a lower average simply because it handled more work items.
Common mistakes
Reading a mean as accumulated capacity demand
A 4h average across nine contributors represents 36h of Review time, not 4h of total load.
Adding the per-row Total instead of one status column
For total Review time, add only the Review cells. A per-item Total can include To Do, In Progress, Review, Done, or other visible status durations.
Dividing by every selected work item automatically
An item that never entered Review may not contribute to the Review average. Keep denominator rules in the average calculation guide rather than assuming the population count always applies.
Averaging displayed group averages
If groups contain different contributor counts, use their raw totals and counts for a weighted result. Here, the simple mean of 4.75, 4.00, and 2.50 is 3.75, while the correct population average is (3 × 4.00 + 4 × 4.75 + 2 × 2.50) ÷ 9 = 4.00 hours.
Comparing runs with different settings
Calendar, timezone, Work item date range, Trim History, scope, and current-status boundaries can change the duration rows before either aggregation is calculated.
Treating the outlier as a cause
The 10h value identifies where to investigate; it does not prove whether the cause was queueing, rework, dependency, availability, or a valid exception.
Frequently asked questions
Is total status time always equal to average times contributor count?
Yes, when both values come from the same unrounded durations and the same contributor rule. Display rounding can make the visible multiplication differ slightly from the raw total.
Does Time in Status show a population total for one status automatically?
Time in Status shows per-work-item status durations and a per-work-item Total. To obtain a population total for Review, sum the Review column in the table or export. Average Time in Status shows aggregate means rather than that population sum.
Which metric should be used for a bottleneck?
Use both layers. A high total shows where much time accumulated; a high average shows where each contributor spent more time on average. Inspect the longest detail rows before naming a bottleneck.
Can this average be compared directly with Jira’s Control Chart?
Not without aligning definitions. Control Chart cycle or lead time can combine selected statuses and has its own population, timeframe, and rolling-average behavior. Match those inputs before comparing a value with one-status Average Time in Status.
What if one work item never entered Review?
Then the selected population and Review contributor count can differ. The total still sums actual Review contributions, while the average must use the product’s Review contributor rule. The denominator guide covers that case in detail.
Related Guides
- How Is Average Time in Status Calculated in Jira?
- How to Calculate Time in Status in Jira Cloud
- How to Find Jira Workflow Bottlenecks
- How to Compare Average Time in Status Across Jira Teams
Reconcile the mean with the work behind it
Use total status time to quantify accumulated load and Average Time in Status to compare per-contributor means. Keep the population, status, history window, and calendar identical, then return to the Time in Status rows whenever an average needs explanation.
Try StatusPath Reports on the Atlassian Marketplace to reproduce the detail-and-average comparison with your Jira work items and permissions.