
How to Find Jira Workflow Bottlenecks
Find Jira workflow bottlenecks by combining cumulative-flow evidence, per-status duration, contributor counts, trends, and work-item inspection.
To find a Jira workflow bottleneck, look for a stage where work accumulates and where many work items consistently spend too long—not merely the single longest item. Start with Jira’s Cumulative Flow Diagram, then verify the suspected stage with per-status durations, contributor counts, a time trend, and the underlying Jira histories. A systemic bottleneck should appear across multiple signals.
What counts as bottleneck evidence?
A bottleneck is a sustained mismatch between arrival rate and a workflow stage’s capacity. Useful evidence includes:
- A widening band in the Cumulative Flow Diagram.
- A status that contributes substantial time across many work items.
- Rising or persistently high duration for that status over comparable periods.
- A queue of items waiting for the same handoff, review, or decision.
- Repeated returns that add rework to the stage.
Atlassian says a continuously widening status band in the Cumulative Flow Diagram usually indicates a bottleneck. The diagram depends on the board’s column mapping, so map statuses correctly before interpreting it. Jira’s Control Chart adds cycle-time, rolling-average, variation, and outlier evidence for selected statuses; Atlassian’s cited Control Chart documentation applies to company-managed spaces, so confirm report availability for the Jira space you are analyzing.
Real Jira scenario: systemic Review delay versus one QA outlier
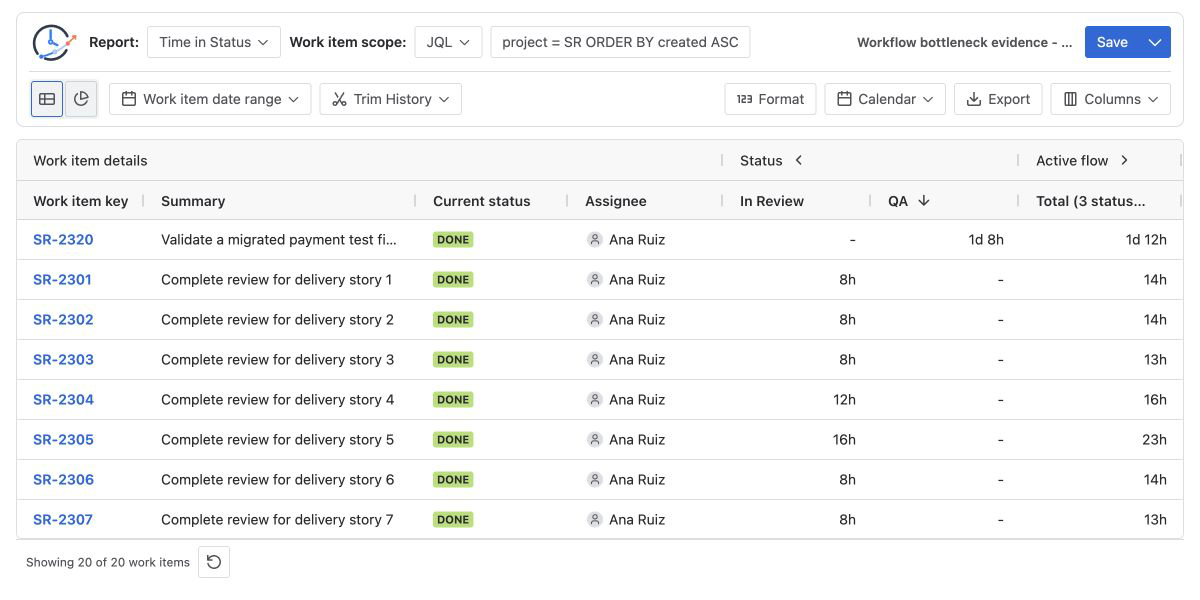
A delivery scope contains 20 work items. Nineteen entered In Review; one skipped it. With My Calendar set to UTC weekdays from 09:00 to 17:00 and Format set to Days, their total Review time is 7d 22h (190 hours). Only one item entered QA, where it spent 1d 8h (32 hours) under the same settings.
In Review average = 7d 22h (190h) ÷ 19 contributors = 10h
QA average        = 1d 8h (32h) ÷ 1 contributor     = 1d 8h
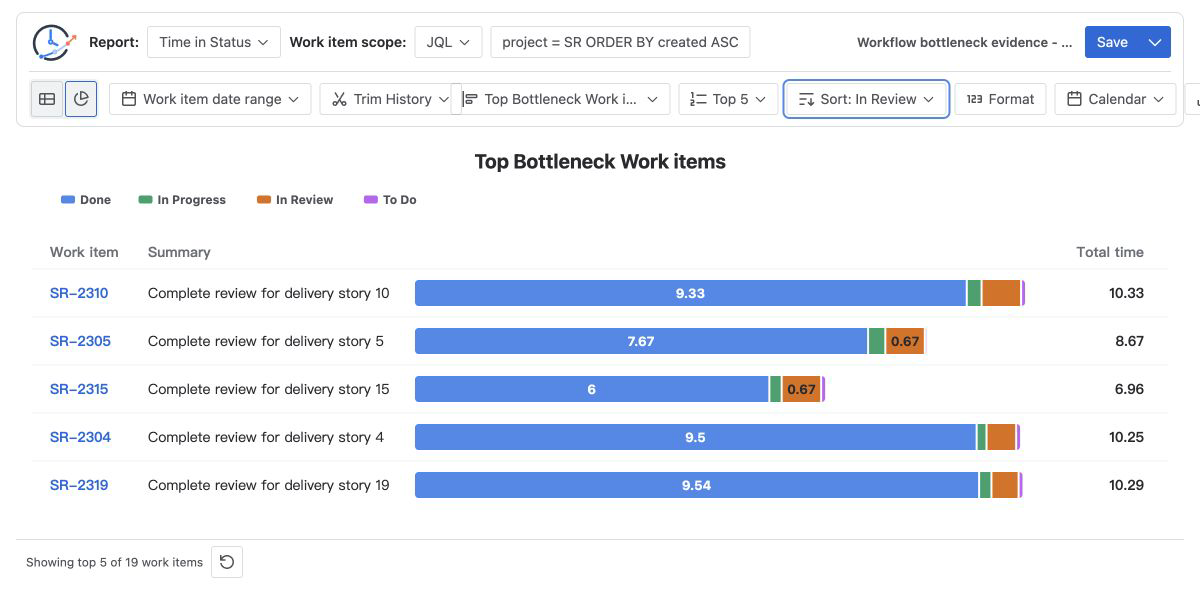
QA has the larger average, but it is supported by one item. In Review affects 19 of 20 items and is therefore the stronger systemic bottleneck candidate. The correct next step is not to ignore the QA outlier; inspect it separately while investigating Review capacity, batching, ownership, and acceptance criteria.
A repeatable bottleneck-analysis workflow
1. Define a stable Jira scope
Choose a Project, saved Filter, JQL, Sprint, or Epic. Decide whether the cohort means items created, updated, or resolved in the period. Atlassian’s report overview describes the Cumulative Flow Diagram as a way to identify potential bottlenecks and the Control Chart as a cycle-time view.
2. Inspect flow accumulation in Jira
Open the Cumulative Flow Diagram for the board. Look for a band that widens over time rather than a one-day spike. Confirm that the board columns represent the workflow stages the team actually wants to measure.
3. Run Time in Status for the same population
Use the same Jira scope in StatusPath Reports. Select the suspected statuses, apply a documented history window, Calendar, and Format, then sort the relevant duration column. See Report setup and scope for the difference between item selection and Trim History.
4. Compare prevalence, average, and outliers
Check how many items contributed to each status. Use Average Time in Status for a status-level comparison, but keep the contributor count visible. Inspect long individual rows before drawing a team-level conclusion.
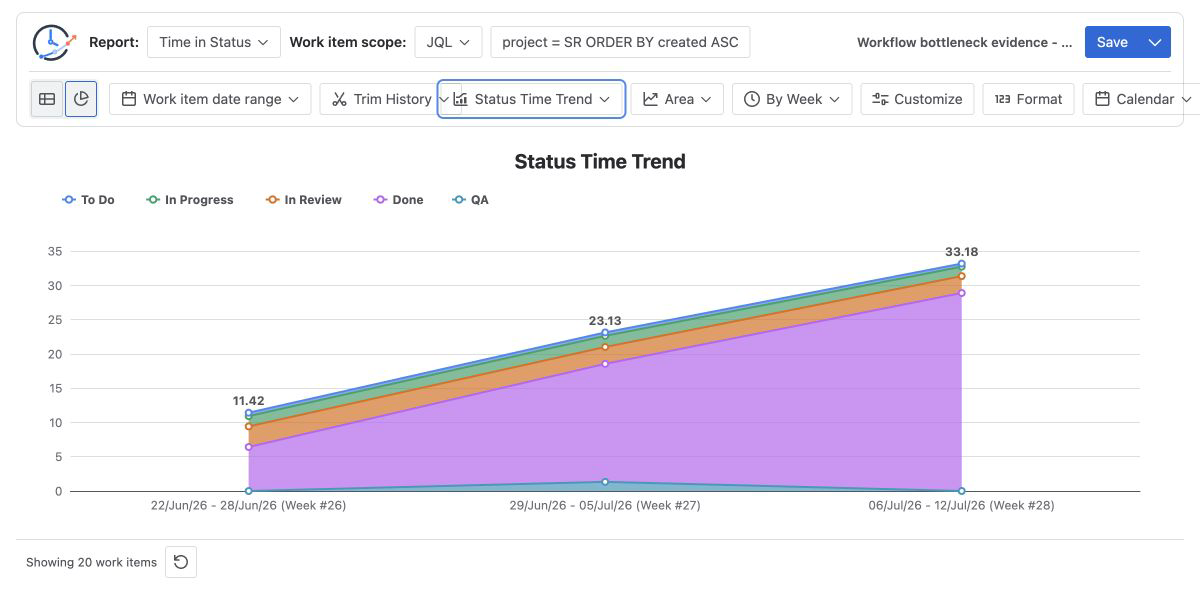
5. Check the trend
Switch to the trend chart and use comparable intervals. A single high week can reflect one release, outage, or imported item. A stage that remains high over multiple periods is stronger evidence.
6. Validate in Jira History and test a change
Open representative fast, typical, and slow items. Confirm transitions in Jira History, then form a specific hypothesis: review capacity is limited, work arrives in batches, ownership is unclear, or items repeatedly return. Change one policy or capacity constraint and compare a later period with the same definition.
Common mistakes
Calling the longest item the bottleneck
One outlier may be a special case. A bottleneck is a repeated system pattern; compare prevalence, distributions, and trends.
Comparing status totals without contributor counts
A large total may simply reflect more items. A large average based on one item may be unstable. Keep both count and duration visible.
Mixing elapsed and business time
Two reports can use identical Jira history and different calendars. Document the timezone, working hours, holidays, and format. See how to exclude weekends.
When the population is a Scrum sprint, use the sprint workflow analysis guide to keep the board filter, completion context, and workflow-history window visible together.
Using mismatched scope or history windows
“Resolved this sprint” and “history inside this sprint” are different definitions. Keep item selection and Trim History separate.
Treating rework as waiting time
A long review could be a queue; repeated review returns could be churn. Use Status Count and Transition Count to distinguish them.
Frequently asked questions
Which Jira report is best for bottlenecks?
Start with the Cumulative Flow Diagram for work accumulation and the Control Chart for cycle-time variation. Add per-status duration when you need work-item and status-level detail.
Is the status with the highest average always the bottleneck?
No. Check contributor count, outliers, work-in-progress accumulation, and persistence over time.
Should Done be included?
Usually exclude terminal-status age when the question is delivery flow, because it can keep growing without representing active process delay. Include it only for a clearly defined analytical question.
How much data is enough?
There is no universal threshold. Use a stable, representative period and show sample sizes. Treat small groups as signals to investigate, not proof.
Can a bottleneck and rework occur together?
Yes. A review stage can have both a queue and repeated returns. Duration measures waiting/processing time; transition counts reveal loops.
Related Guides
- How to Find Jira Work Items with the Longest Time in Status
- How to Calculate Time in Status in Jira Cloud
- How to Find a Code Review Bottleneck in Jira
- How to Analyze a QA or Testing Bottleneck in Jira
- How to Measure Jira Rework
- How to Monitor Jira Workflow Bottlenecks with a Dashboard Gadget
- How to Compare Average Time in Status Across Jira Teams
- Jira Workflow Review Checklist
- Weekly Jira Workflow Report Example for Management
Turn a suspicion into a testable workflow change
StatusPath Reports combines per-work-item status duration, grouped averages, bottleneck charts, trends, calendars, saved configurations, and export. Use it to build a reviewable evidence set, then validate the relevant items in Jira before changing the workflow.
Try StatusPath Reports on the Atlassian Marketplace to investigate Jira workflow delays with repeatable report settings.