
How to Analyze a QA or Testing Bottleneck in Jira
Separate Jira QA queue time, Testing duration, and retest loops with status durations, entry counts, transitions, and a reproducible 18-Bug example.
To analyze a Jira QA bottleneck, separate time before testing from time in testing and from retest loops. Compare Waiting for QA, Testing, and Ready for Retest durations, then use Status Count and Transition Count to locate repeated Testing entries and the paths that produced them. Treat status occupancy as elapsed workflow evidence—not tester labor, defect cause, or individual performance—and map these labels to your local workflow.
Define the QA queue, testing stage, and retest loop separately
A useful QA bottleneck analysis asks three narrower questions:
| Question | Example workflow evidence | Report |
|---|---|---|
| How long did work wait before testing began? | Time in Waiting for QA | Time in Status |
| How long did work occupy the testing stage? | Time in Testing | Time in Status or Average Time in Status |
| Which Bugs returned for another test pass? | Testing entry count and directional reopen transitions | Status Count and Transition Count |
This page focuses on those three QA-stage questions. Use the broader Jira workflow bottleneck guide when the suspected constraint could be anywhere in the delivery workflow, and use the Jira rework guide for a general method that is not specific to QA.
Atlassian defines a Jira workflow as statuses and transitions through which a work item moves during its lifecycle. The names in this example are not universal. Before calculating anything, map the statuses in each local workflow to these analytical roles:
| Analytical role | Status used in this example | Possible local equivalents |
|---|---|---|
| QA queue | Waiting for QA | QA Ready, Ready for Test, Awaiting Validation |
| Test stage | Testing | In QA, Test in Progress, Validation |
| Retest queue | Ready for Retest | Fix Ready, Awaiting Retest, Ready for QA |
| Reopen signal | Testing → Reopened | QA Failed, Reopen Bug, Return to Development |
Do not merge all four roles into one “QA” number before diagnosing the delay. A broad status group can be useful later for an executive total, but it hides whether the time came from queueing, the test-stage status, or a return path. Columns and grouping explains how StatusPath status groups sum selected status durations or entry counts; publish the mapping whenever teams use different names.
Reproducible Jira test scenario: 18 Bugs moving through QA
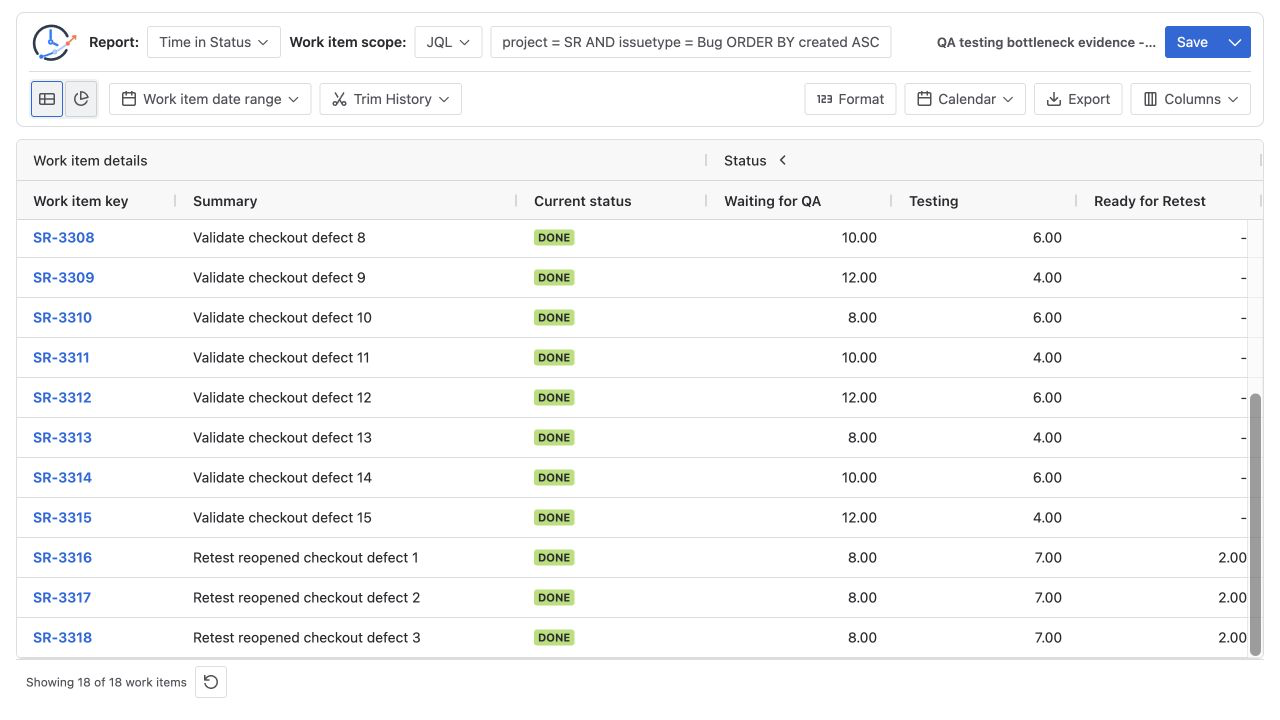
The report scope contains Bugs SR-3301 through SR-3318, using synthetic demonstration data in a Jira test project. The saved example uses a 24×7 calculation calendar named All time (UTC) to pin the calculation timezone to UTC, renders Decimal Hours, calculates the complete scenario history, and keeps Waiting for QA, Testing, and Ready for Retest as separate columns. This named calendar belongs to the reproducible example configuration; it is not Jira’s or StatusPath’s default calendar. See Calendars and duration formats before substituting a business calendar for your own report.
The first 15 Bugs follow the normal path:
In Progress → Waiting for QA → Testing → Done- Their Waiting for QA durations repeat
8h, 10h, 12hfive times:5 × (8h + 10h + 12h) = 150h. - Their Testing durations alternate
4h, 6h, starting with 4h: eight Bugs contribute 4h and seven contribute 6h, for8 × 4h + 7 × 6h = 74h.
The remaining three Bugs, SR-3316 through SR-3318, follow a retest path:
In Progress → Waiting for QA (8h) → Testing (4h) → Reopened (1h)
→ In Progress (3h) → Ready for Retest (2h) → Testing (3h) → Done
Each of these Bugs contributes 8h to Waiting for QA, a combined 7h across its two Testing visits, and 2h to Ready for Retest.
Use this reproducible report configuration:
| Setting | Value |
|---|---|
| Work item scope | JQL: project = SR AND issuetype = Bug ORDER BY created ASC; verify the result contains SR-3301 through SR-3318 |
| Report type | Time in Status |
| History | Complete scenario history; no Trim History boundary |
| Calendar | All time (UTC) |
| Format | Decimal Hours |
| Duration columns | Waiting for QA, Testing, Ready for Retest |
| Validation fields | Work item key, Summary, Current status |
Calculate queue time, testing time, and retest time
Calculate each status independently and use the number of contributing Bugs as the denominator:
| Status | Normal-path total | Retest-path total | Contributors | Total | Average per contributor |
|---|---|---|---|---|---|
| Waiting for QA | 150h | 3 × 8h = 24h | 18 | 174h | 174h ÷ 18 = 9.67h |
| Testing | 74h | 3 × (4h + 3h) = 21h | 18 | 95h | 95h ÷ 18 = 5.28h |
| Ready for Retest | 0h | 3 × 2h = 6h | 3 | 6h | 6h ÷ 3 = 2.00h |
The Testing denominator is 18 Bugs, not 21 entries. The three retest Bugs each contribute one row whose two Testing intervals sum to 7h. Ready for Retest uses three contributors because the other 15 Bugs never entered that status.
In this scope, Waiting for QA has the largest total and average, making the pre-test queue a candidate bottleneck. The calculation does not identify its cause. Check priority, environment availability, release timing, and the underlying work items before forming a hypothesis.
Confirm the signal persists across comparable periods
One 18-Bug cohort identifies a candidate, not a persistent constraint. Compare another week, month, or similarly sized release cohort while keeping the work item scope, status mapping, Calendar, Format, and Trim History rule unchanged. Report both the aggregate duration and the number of Bugs contributing to each status; a high total produced by many Bugs is different from an isolated outlier.
If Waiting for QA remains high or rises across comparable periods while contributor counts remain visible, the bottleneck interpretation is stronger. If the signal disappears, investigate cohort mix and configuration changes before claiming improvement. Use the same persistence test for the upstream Code Review bottleneck analysis.
Use entry counts to isolate retest candidates
Switch to Status Count without changing the work item scope or history window. The 15 normal-path Bugs entered Testing once. SR-3316, SR-3317, and SR-3318 entered Testing twice, so those three rows are the retest candidates.
Normal-path Testing entries = 15 × 1 = 15
Retest-path Testing entries =  3 × 2 =  6
All Testing entries         = 15 + 6 = 21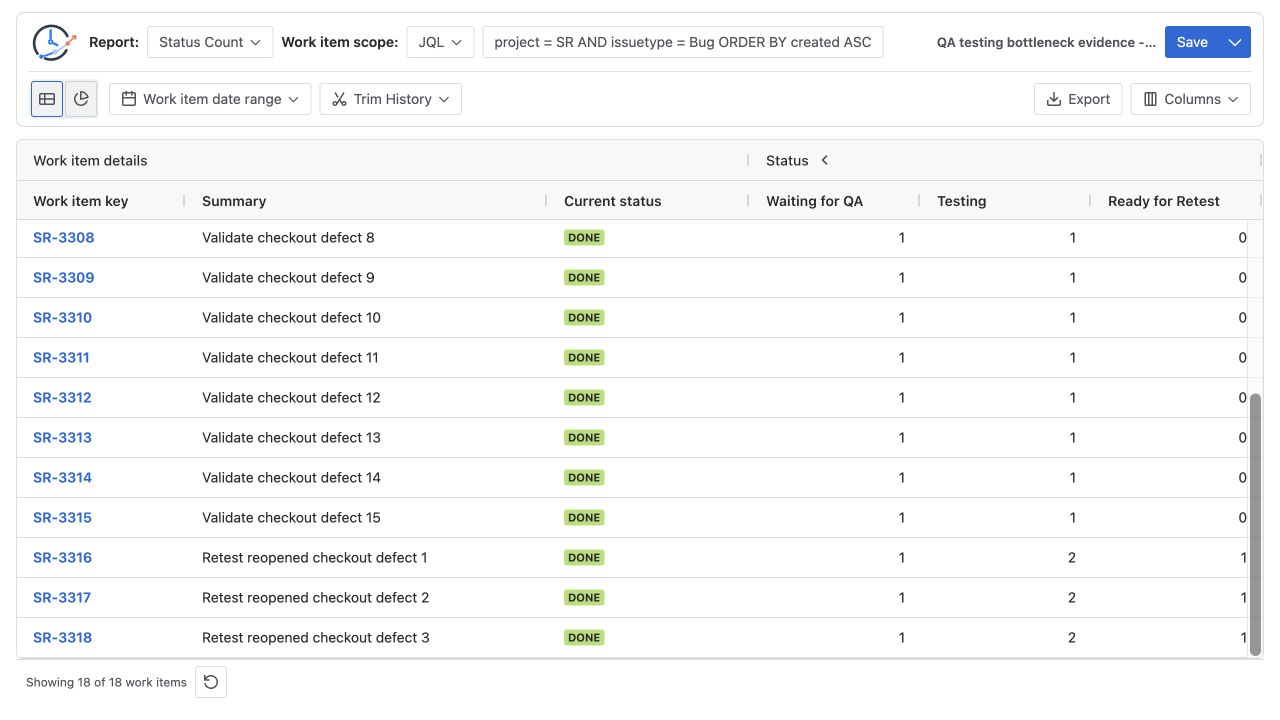
A second Testing entry is evidence of repetition, but not its explanation. The work item might have been reopened because of a defect, changed requirements, an environment problem, an automation rule, or another valid workflow route. Use Transition Count and Jira History before classifying it.
Confirm the direction of the QA loop
Atlassian notes that workflow transitions are one-way. Moving from Testing to Reopened and later returning from Ready for Retest to Testing are separate transitions. Count the directions required by the written retest definition rather than treating every entry into Testing as equivalent.
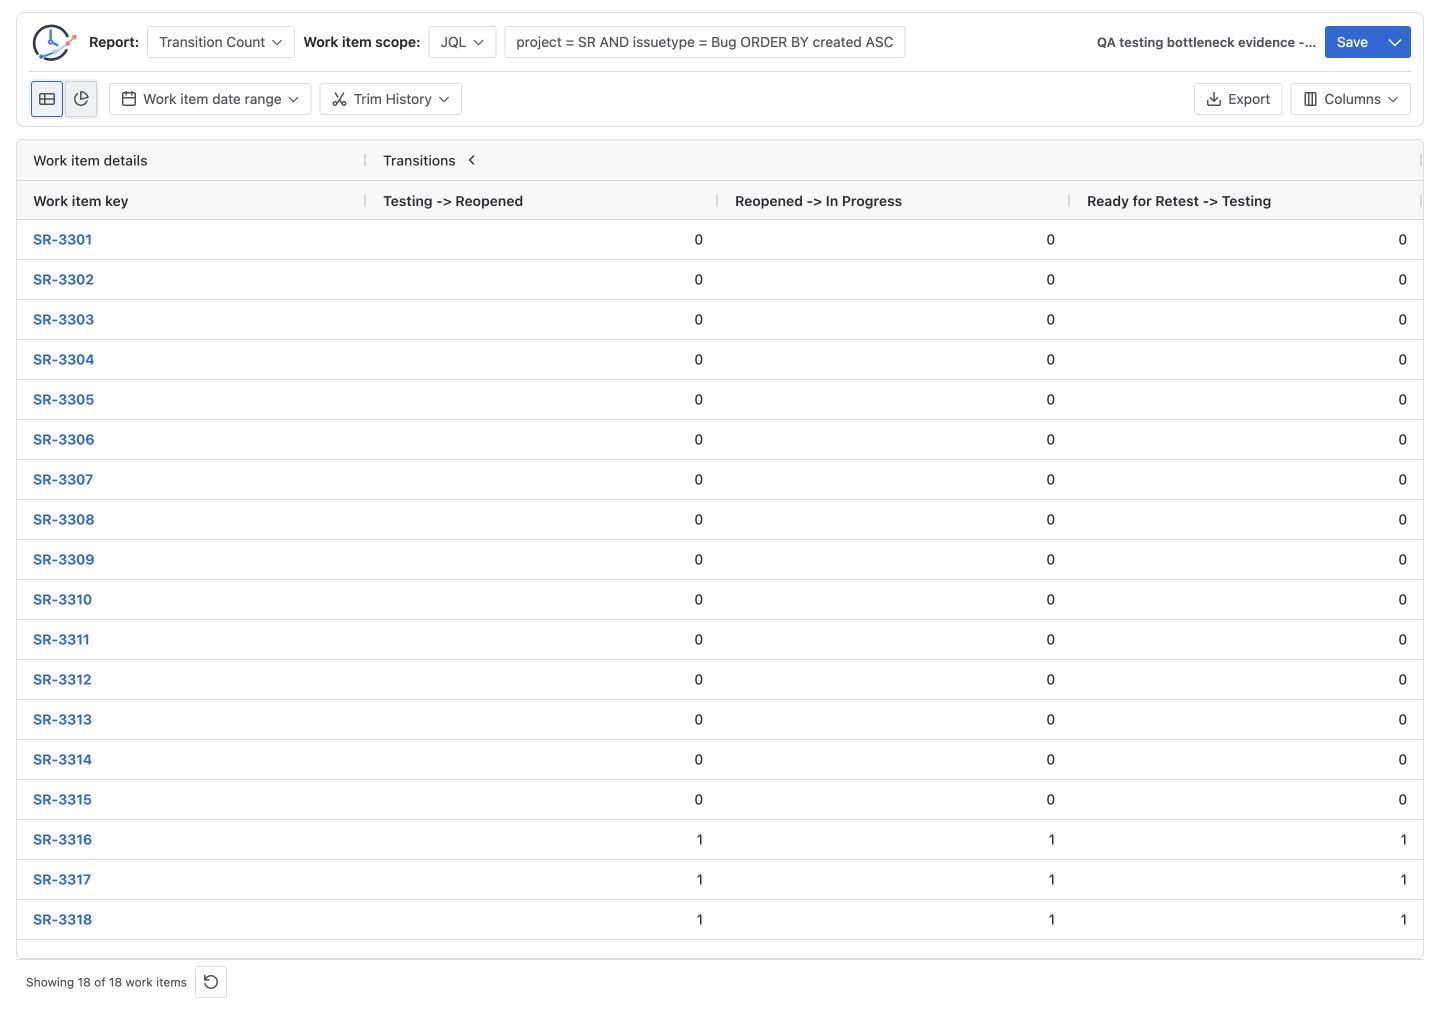
For this scenario, the three diagnostic transition totals are:
| Transition | Total count | Meaning in this workflow |
|---|---|---|
| Testing → Reopened | 3 | Three Bugs left the test stage through the reopen route |
| Reopened → In Progress | 3 | The same three Bugs returned to development |
| Ready for Retest → Testing | 3 | The three Bugs began another test pass |
JQL can help select Bugs that experienced a known movement:
project = SR
AND status CHANGED FROM "Testing" TO "Reopened"
ORDER BY key ASC
Atlassian’s JQL operators reference documents CHANGED with predicates including FROM, TO, AFTER, BEFORE, and DURING. The query above can find work items that matched the path, but standard JQL search does not create a per-work-item column showing how many times it occurred. Use Transition Count or a changelog-based calculation when occurrence counts matter.
Run a repeatable QA bottleneck review
1. Write the local status mapping
Record which statuses mean waiting, active test stage, waiting for retest, and return to development. If two projects use different names, either analyze them separately or create a documented status group while retaining the base-status evidence.
2. Fix the population and history window
Choose a Project, saved Filter, JQL, Sprint, or Epic, then record any Work item date range and Trim History rule. Selection time and calculated history time answer different questions. Keep the same scope for all three reports; Report setup and scope documents these controls, and the date-range clipping guide explains the boundary model.
3. Start with Time in Status
Keep queue, Testing, and retest columns separate. Sort each duration column, inspect the distribution, and reconcile the visible rows with the status total. Before interpreting Average Time in Status, reconcile its contributor count against the same scoped Time in Status or Status Count rows.
4. Screen with Status Count
Look for Testing or Ready for Retest values above the expected normal-path count. A value above one is only a candidate signal until the route is checked.
5. Diagnose with Transition Count
Select the exact forward and backward transitions in the team’s written definition. Report the number of affected Bugs separately from the number of transition events.
6. Validate representative Bugs in Jira
Open a long Waiting for QA item, a normal Testing item, and each high-count retest item. Atlassian describes Activity → History as recording field edits and movements through the workflow. Reconstruct the timestamps and directions before assigning a cause.
7. Compare a comparable period
Repeat the report for another period with the same scope definition, status mapping, Calendar, Format, and Trim History rule. Keep each status total beside its contributing Bug count so changes in cohort size are not mistaken for a process change.
8. Record a testable follow-up
Examples include reviewing intake batching, environment readiness, priority rules, or reopen criteria. Change one policy or constraint, then compare another period with the same scope, status mapping, calendar, and history rule.
Common mistakes
Combining queue and testing time too early
A single QA status group can show a broad total but cannot tell whether work waited to start, occupied the Testing stage, or waited for a retest. Keep the base statuses visible during diagnosis.
Treating status occupancy as tester labor
Time in Testing is elapsed or business time under the selected calendar. It can include unattended time, environment delay, handoffs, automation, and non-working periods. It is not a timesheet.
Assigning a defect cause from a reopen transition
Testing → Reopened proves a workflow movement, not why it happened. Review the Bug, comments, fields, and History before classifying the cause.
Using the wrong denominator
Ready for Retest averages across the three Bugs that entered it, not all 18. Testing averages across 18 contributing Bugs even though there are 21 Testing entries.
Expecting JQL to produce transition counts
status CHANGED FROM ... TO ... is useful for filtering a known path. It does not replace a per-work-item Transition Count result.
Frequently asked questions
Which Jira status proves there is a QA bottleneck?
No single status proves it. Compare queue duration, Testing duration, contributor count, repeated entries, directional transitions, and representative Jira histories. A bottleneck conclusion should match the local workflow definition.
Should Waiting for QA and Testing be one status group?
Not for the first diagnostic pass. Keep them separate so queueing and test-stage occupancy remain distinguishable. A documented combined group can be added later for a broader total.
Does a long Testing duration measure active tester work?
No. It measures how long the work item occupied that status under the selected calendar and history rules. It does not directly measure hands-on tester labor.
Can JQL find Bugs that went through a retest loop?
JQL CHANGED FROM ... TO ... can filter Bugs that experienced a specified movement. It does not show a per-item occurrence count, and multiple change clauses do not by themselves prove the chronological relationship between separate events. Validate the route with Transition Count and History.
How should the three retest Bugs be reported?
Report both levels: 3 of 18 Bugs entered Testing twice, and the defined Testing → Reopened, Reopened → In Progress, and Ready for Retest → Testing transitions each occurred three times. Keep that event evidence separate from any later cause classification.
Related Guides
- How to Find Jira Workflow Bottlenecks
- How to Measure Jira Rework with Status Count and Transition Count
- How to Calculate Time in Status in Jira Cloud
- Jira Workflow Reporting Guide
- How to Find a Code Review Bottleneck in Jira
- How Jira Time in Status Date Ranges Clip History
Turn QA delay into a reviewable workflow question
Separate queueing, Testing, and retest evidence before proposing a fix. StatusPath Reports can calculate the three duration columns, screen repeated Testing entries, and show the exact transition directions for the same Jira scope.