
How to Find a Code Review Bottleneck in Jira
Find a Jira code review bottleneck using Review duration, repeated entries, rollback transitions, and trends without inferring reviewer productivity.
To find a code review bottleneck in Jira, define which status represents Review, measure its per-story occupancy, separate one-entry stories from repeated entries, and check whether the signal persists in comparable time buckets. Use Transition Count and Jira History to validate In Review → In Progress returns. Treat the result as workflow evidence: status occupancy does not prove pull-request activity, reviewer labor, or individual output.
What this analysis can and cannot establish
This page answers a narrow engineering-retrospective question: does the Jira Review stage show broad waiting, repeated review loops, a persistent trend, or a mixture of those patterns? The complete Jira workflow bottleneck guide owns the general method across all workflow stages. This page does not repeat that broader diagnosis.
First define the Review boundary. A team might use In Review, Waiting for Review, or several statuses mapped to one board column. Jira History records status changes and their timestamps; StatusPath reconstructs the resulting status intervals under the report’s history-window and Calendar settings. Delayed Jira transitions can make that recorded occupancy differ from the underlying development activity.
Use three separate signals:
| Signal | Question it answers | What it does not establish |
|---|---|---|
| Review duration distribution | Which stories accumulated Review time, and how widely is delay spread? | Active PR review time or cause |
| Status and transition counts | Which stories re-entered Review, and which returned to In Progress? | Whether every return was avoidable rework |
| Review trend | Does the duration signal persist across comparable buckets? | Why the trend changed |
Atlassian’s Control Chart documentation explains that the chart maps cycle time or lead time from selected statuses and shows the average, rolling average, and standard deviation. That page applies to company-managed spaces only. Use it when that native report is available, but keep its configured columns visible: a Control Chart covering several stages is not the same metric as a Review-only status-duration report.
What Jira can find and verify natively
JQL can select stories that entered Review:
project = SR
AND issuetype = Story
AND status CHANGED TO "In Review"
It can also isolate a known rollback path:
project = SR
AND issuetype = Story
AND status CHANGED FROM "In Review" TO "In Progress"
Atlassian’s JQL operator reference documents CHANGED predicates including FROM, TO, AFTER, BEFORE, and DURING. These queries return matching work items; they do not return a per-item column containing the number of repeated Review entries or rollbacks. Use counts derived from work-item history when frequency matters.
For an item-level check, open the work item Activity area and select History. Atlassian describes work item History as the record of updates such as field edits and workflow movements. Use it to confirm the Review entry and exit timestamps for representative stories.
Reproducible Jira test scenario: long one-entry waits and four review loops
An engineering retrospective covers 16 Stories. The screenshots use synthetic demonstration data in a Jira test project. This demonstration explicitly selects the All time (UTC) Calendar, a Decimal Hours format, and a history window that contains every Review interval in the scenario. All time (UTC) is the article-demo configuration, not a built-in product default. A production retrospective should deliberately choose and document the team’s applicable Calendar instead.
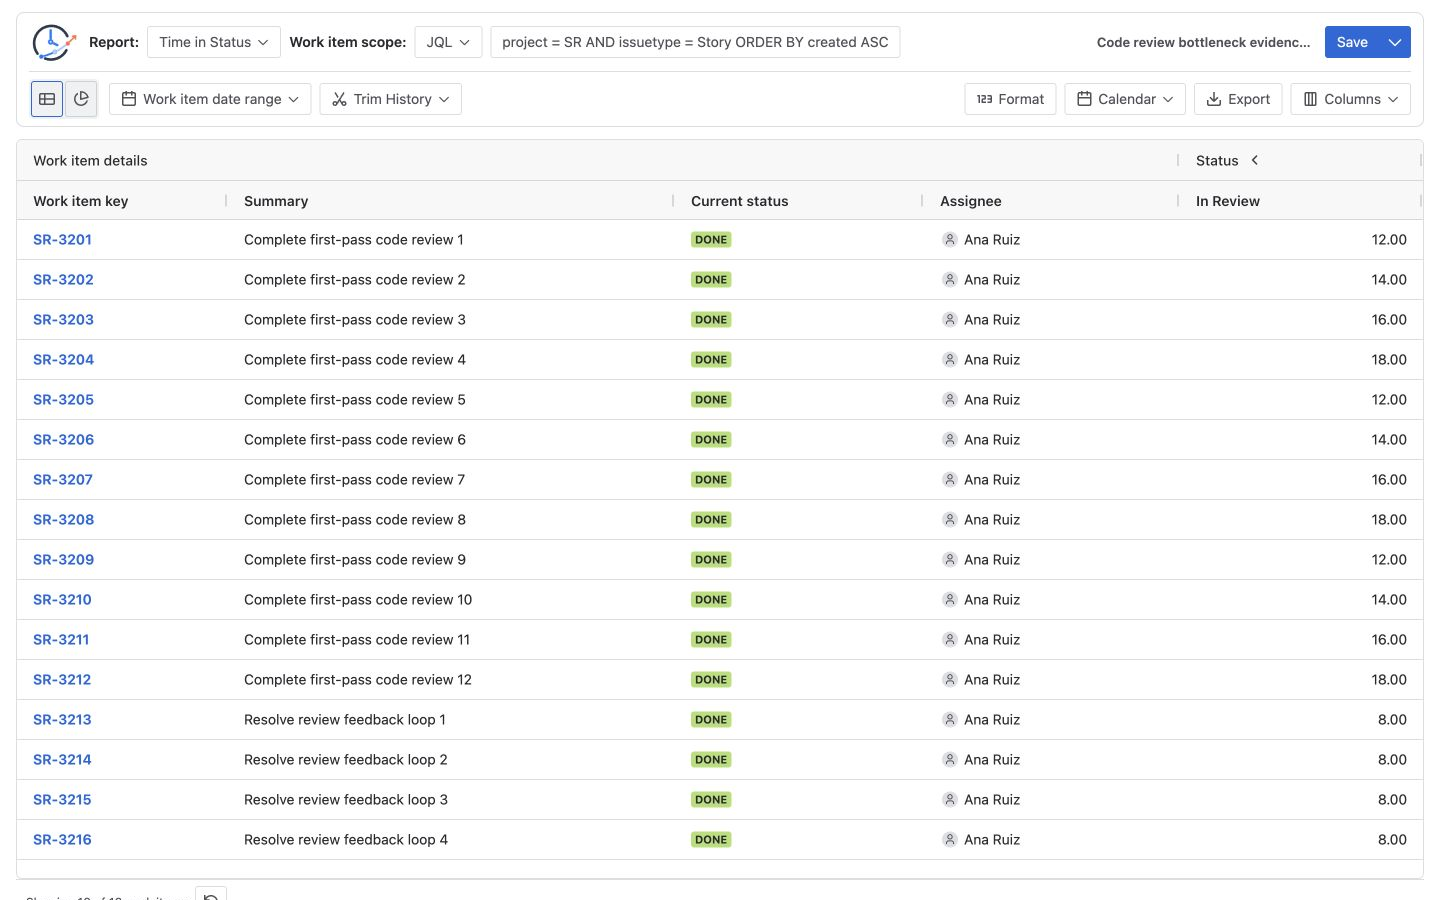
Twelve Stories enter In Review once. Their Review durations repeat 12h, 14h, 16h, 18h three times. The other four Stories each enter In Review twice, spend 4h + 4h = 8h there, and have exactly one In Review → In Progress rollback.
| Story group | Stories | Review entries per story | Review duration pattern | Group Review total | Group average | Rollbacks |
|---|---|---|---|---|---|---|
| One-entry Review | 12 | 1 | 12h, 14h, 16h, 18h × 3 | 180h | 15h | 0 |
| Re-entered Review | 4 | 2 | 4h + 4h each | 32h | 8h | 4 |
| All Stories | 16 | Mixed | Both patterns | 212h | 13.25h | 4 |
The manual calculation is:
One-entry Review total   = 3 × (12h + 14h + 16h + 18h) = 180h
One-entry group average  = 180h ÷ 12 = 15h

Re-entered Review total  = 4 × (4h + 4h) = 32h
Re-entered group average = 32h ÷ 4 = 8h

Overall Review total     = 180h + 32h = 212h
Overall Review average   = 212h ÷ 16 = 13.25h

Re-entered Stories       = 4 ÷ 16 = 25%
Review rollbacks         = 4 × 1 = 4 events
The overall average hides two different findings. The 12 one-entry Stories have the longer Review average, so repeated returns are not required for a Review delay to exist. The four looped Stories have a lower total Review duration but still expose a separate workflow-churn signal. Neither pattern identifies a cause until the underlying work items and development evidence are reviewed.
A repeatable Review-bottleneck workflow
1. Write the status boundary before running the report
Record the status or status group that represents Review. If Waiting for Review and In Review mean different things, keep them separate. If the team uses one broad In Review status for waiting, active discussion, automated checks, and approval, state that limitation in the retrospective.
2. Choose a stable population and configuration
Use one Project, saved Filter, JQL, Sprint, or Epic. For the worked example:
- Population: the same 16 Stories returned by
project = SR AND issuetype = Story ORDER BY created ASC. - History rule: include every Review entry and exit used in the retrospective.
- Calendar:
All time (UTC)for this calculation, so every elapsed interval counts; use one documented team calendar for every production duration view. - Table Format: Decimal Hours.
- Review columns:
In Review, plus the work-item fields needed for context.
Work item selection and Trim History answer different questions. A Sprint source selects the population; Trim History clips the Jira history calculated for those rows. See Report setup and scope and how Time in Status date ranges clip history before comparing two periods.
3. Inspect the Review distribution
Run Time in Status, sort In Review from longest to shortest, and optionally apply a duration filter to create a review list. Do not stop at the average. Check the row count, median or spread outside the product if needed, the longest rows, and whether a broad part of the population is elevated under the same settings.
Use Calendars and duration to document the schedule and display unit. A different Calendar can change duration values even when Jira history is unchanged.
4. Separate one-entry waiting from repeated Review
Switch to Status Count with the same population and history window. Filter or sort In Review to find values above one. In this scenario, exactly four Stories have In Review = 2; the other 12 have In Review = 1.
Then use Transition Count to confirm direction. The four repeated-entry Stories each have In Review → In Progress = 1, for four rollback events in total. A repeated entry without the expected backward transition should be investigated rather than classified automatically.
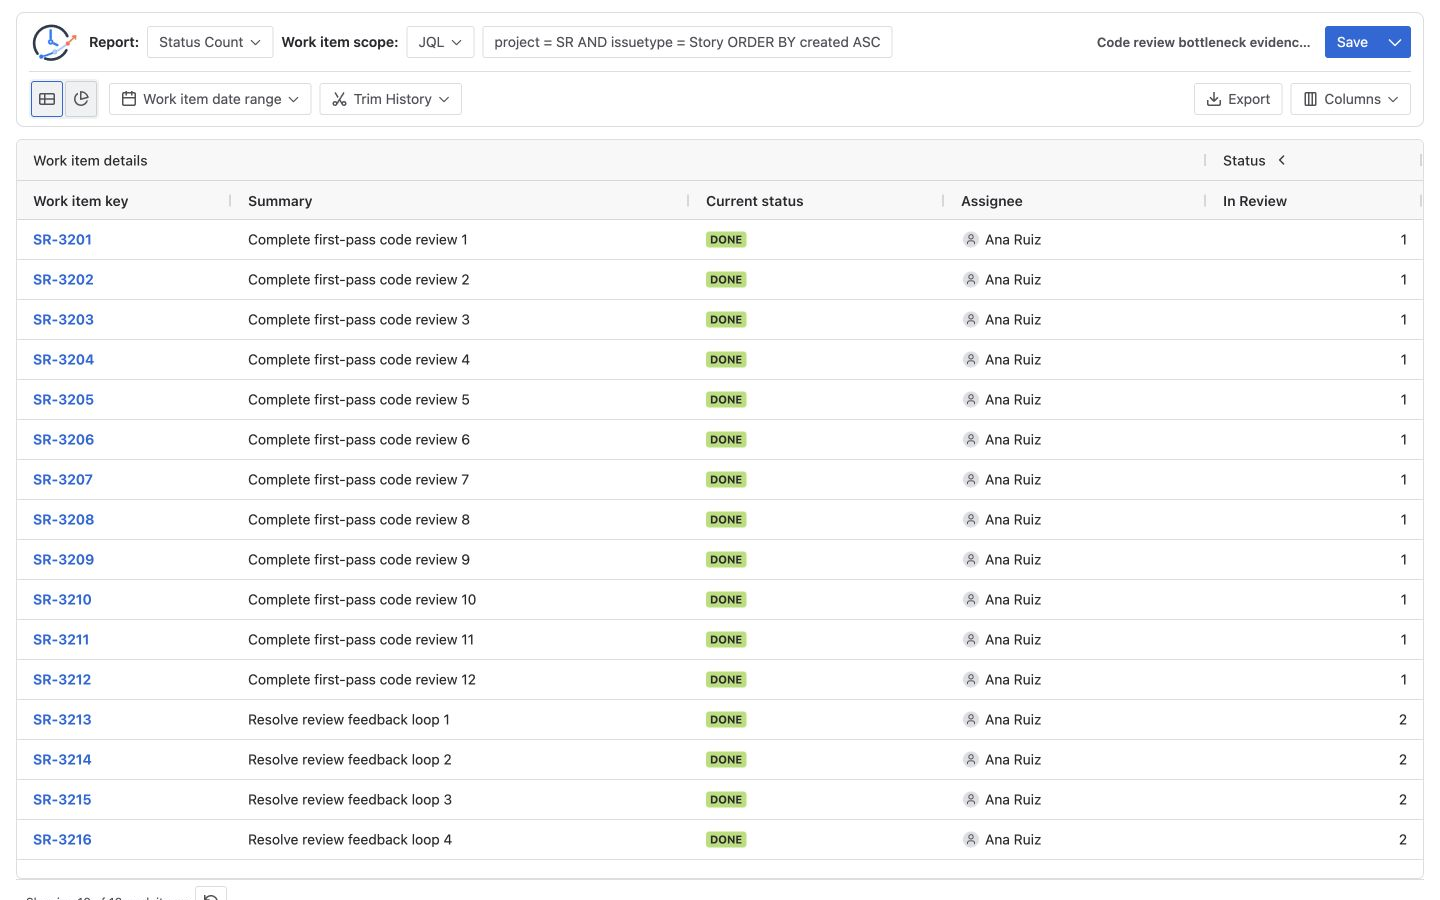
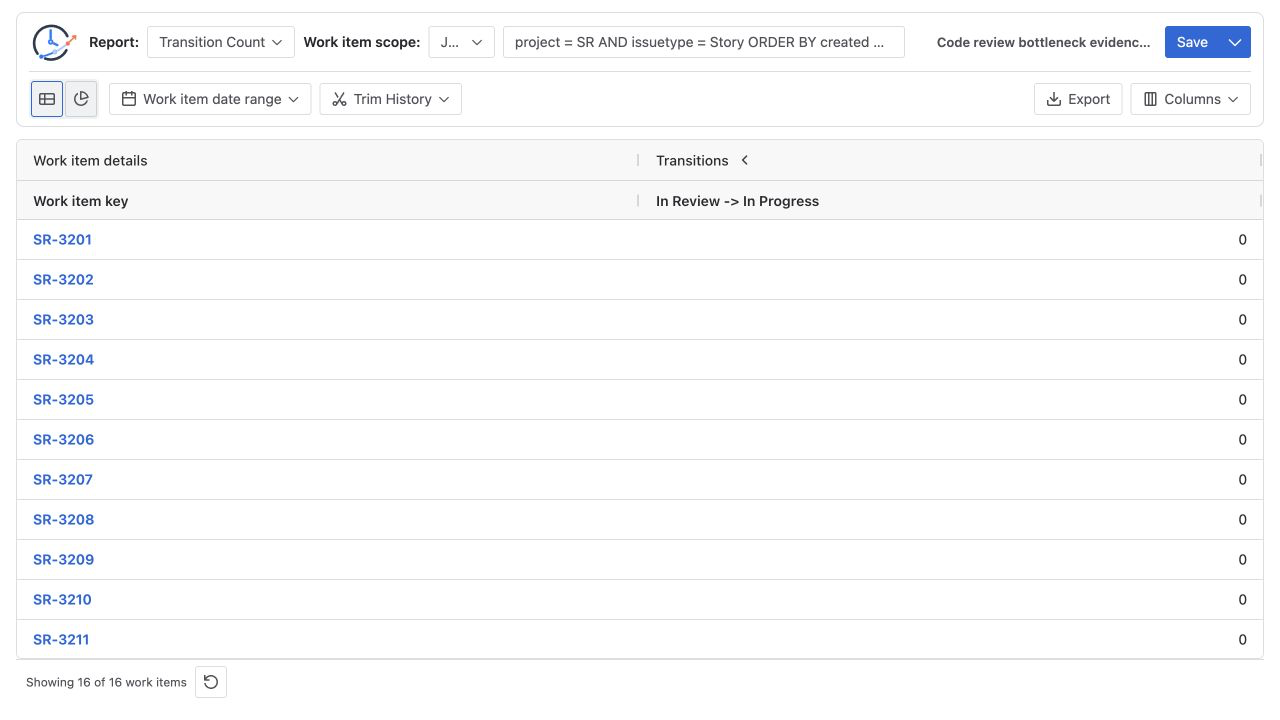
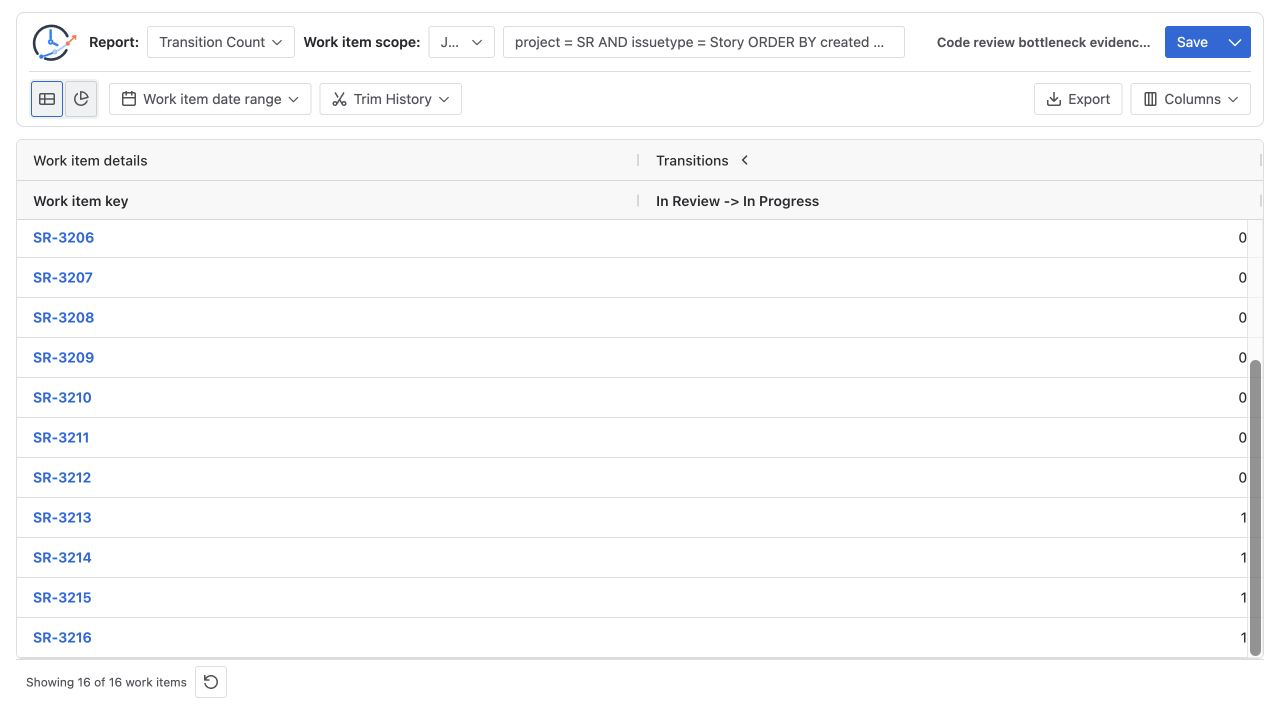
The Jira rework guide explains why Status Count is the screening view and Transition Count is the directional validation view.
If the delay appears after Review rather than inside it, compare this workflow with the QA and Testing bottleneck analysis.
5. Check the Review series without treating the whole stack as Review
Open Status Time Trend for the Time in Status result. Use comparable day, week, month, quarter, or year buckets and retain the same scope, Review boundary, Calendar, Format, and history rule. Status Time Trend allocates accumulated status duration into time buckets; it is not automatically a fixed-cohort average.
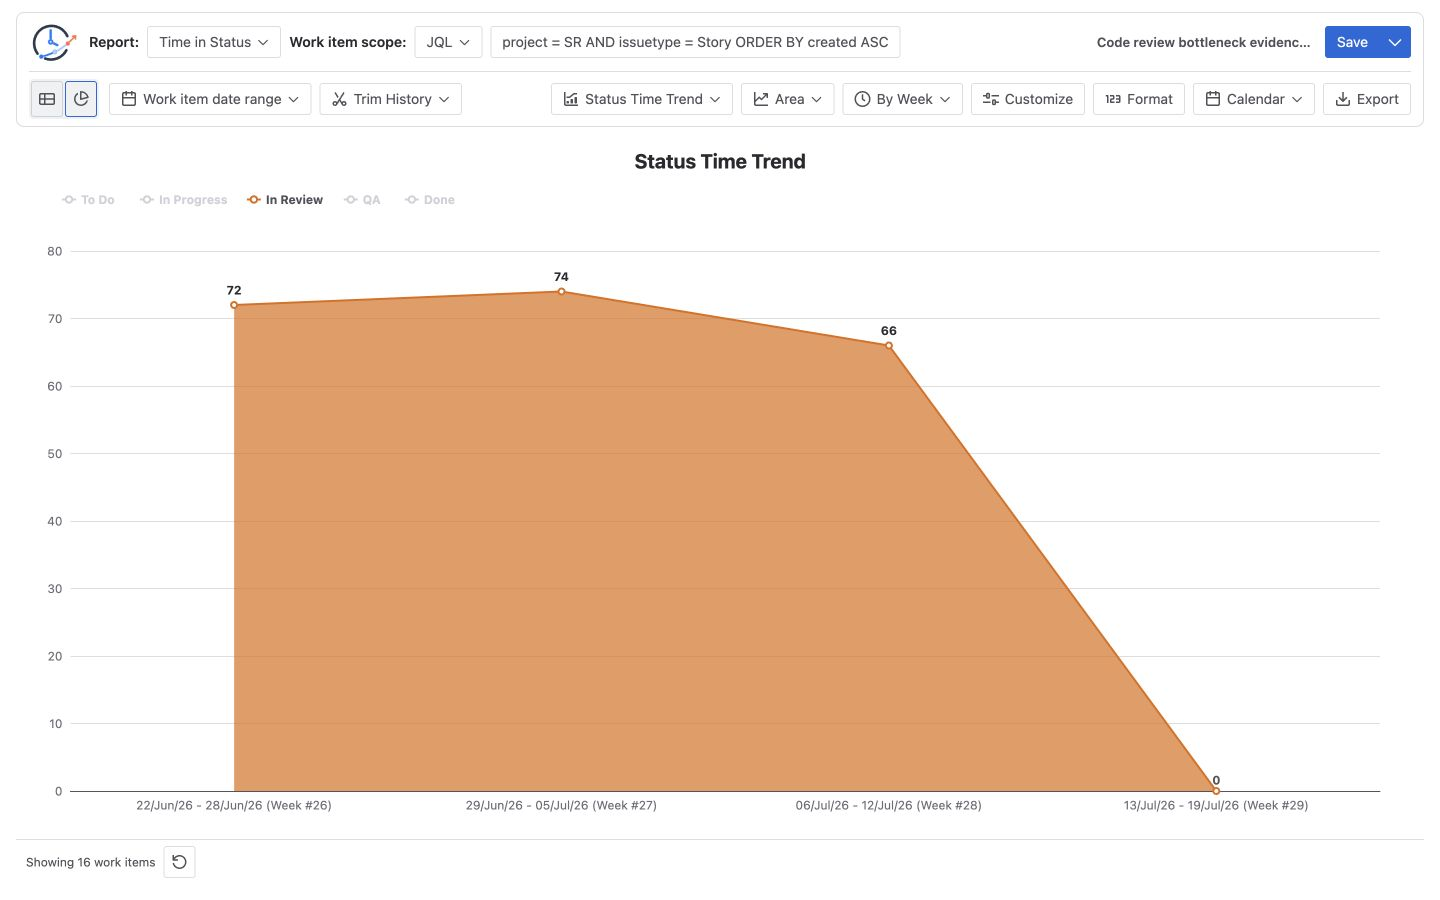
The chart initially contains To Do, In Progress, In Review, QA, and Done. Click the other four legend labels to temporarily hide those series and leave In Review visible, as shown below. Legend visibility is a chart interaction rather than part of the saved report configuration, so repeat it after a clean reload. For this scenario, the visible Review series and the independently reconciled contributor counts are:
| Weekly bucket | In Review duration | Stories contributing In Review time |
|---|---|---|
| Jun 22–28 | 72h | 5 |
| Jun 29–Jul 5 | 74h | 5 |
| Jul 6–12 | 66h | 6 |
| Jul 13–19 | 0h | 0 |
The first three active Review buckets are similar in aggregate duration; the fourth is zero because no Review interval contributes time to that bucket. It is not, by itself, proof that Review improved. Keep contributor counts visible and use Average Time in Status or a separate normalized calculation when the question is average duration rather than aggregate status time.
Read Chart view for the supported trend intervals and duration controls.
6. Validate work items and frame the retrospective
Open all four looped Stories, plus a long, middle, and short one-entry Story. Compare StatusPath values with Jira History and, when available, the team’s pull-request system. Ask:
- Were long Review intervals waiting for pickup, active discussion, or a late Jira transition?
- Did each rollback reflect requested changes, a scope change, an incorrect transition, or an intended workflow path?
- Are delays concentrated in a component, work type, priority, or handoff?
- Did the Review definition, Calendar, or history window change between trend buckets?
- Which one process experiment can be evaluated with the same report definition next time?
Record the evidence and the uncertainty. Do not turn Review occupancy into a reviewer leaderboard.
Common mistakes
Treating Review occupancy as pull-request activity
A Jira status interval does not show when a PR was opened, when comments occurred, or when someone actively reviewed code. Validate against development evidence before making those claims.
Using only the overall average
The 13.25-hour average conceals a 15-hour one-entry group and an 8-hour re-entry group. Keep row-level distribution and entry counts beside the summary.
Assuming JQL returns repeat counts
status CHANGED finds matching work items. It does not produce the In Review = 2 or rollback-count columns needed for this retrospective.
Comparing different calendars or history windows
Changing business hours, timezone, exceptions, Trim History, or the selected population can change the result. Keep those settings with every comparison.
Calling every Review return a defect
A backward transition can represent requested changes, a corrected status, a deliberate workflow path, automation, or actual rework. Inspect Jira History and the work item before classifying it.
Frequently asked questions
Can Jira measure pull-request review time from status history?
Jira can measure how long a work item was recorded in a Review-related status. That is not automatically the same as PR open time, active review time, or reviewer labor unless the team’s integration and workflow keep those events aligned and the alignment is validated.
Is the status with the highest average always the bottleneck?
No. Check how many Stories contributed, the distribution, outliers, repeated entries, directional transitions, and persistence over comparable periods. The broader workflow bottleneck guide shows the complete evidence ladder.
Can JQL tell me how many times each Story entered Review?
JQL CHANGED TO "In Review" can find Stories that made the movement. The query itself does not return a per-Story repetition count. Use Status Count or calculate from changelog history.
How should two Review intervals be calculated?
Add the included intervals under the same Calendar and history window. In this example, each looped Story contributes 4h + 4h = 8h of Review occupancy and has an In Review Status Count of 2.
Does Jira’s Control Chart work for every space type?
The Atlassian Control Chart page cited here applies to company-managed spaces only. Confirm the native reports available in the actual Jira space before using that chart; the status-duration and transition analysis still requires a clearly defined population and Review boundary.
Related Guides
- How to Find Jira Workflow Bottlenecks
- How to Measure Jira Rework with Status Count and Transition Count
- How Is Average Time in Status Calculated in Jira?
- Jira Sprint Workflow Analysis: Time, Rework, and Trends
- How Jira Time in Status Date Ranges Clip History
- How to Analyze a QA or Testing Bottleneck in Jira
Turn a Review suspicion into a verifiable retrospective
StatusPath Reports can place Time in Status, Average Time in Status, Status Count, Transition Count, and Status Time Trend around the same Jira population. Use those views to preserve duration, repetition, and trend as separate evidence, then validate representative Stories in Jira History and the team’s development system before changing the workflow.