
Chart View
Charts help you summarize the report result after the table has data. Use charts to spot bottlenecks, compare status or assignee patterns, and prepare a visual export. Use the table when you need the detailed row-level explanation behind the chart.
If Chart view is unavailable or empty, switch back to Table first. The table shows whether the report has rows and whether the values needed by the chart exist.
Chart availability
Switch from Table to Chart in the report result toolbar. Chart availability depends on the selected report type and the current result data.
Time in Status has two chart types:
- Top Bottleneck Work items
- Status Time Trend
These report types use a shared trend chart:
- Average Time in Status
- Status Count
- Status Entry Date
- Transition Count
- Time in Assignee
Top Bottleneck
Top Bottleneck ranks work items by duration. It is available for Time in Status.
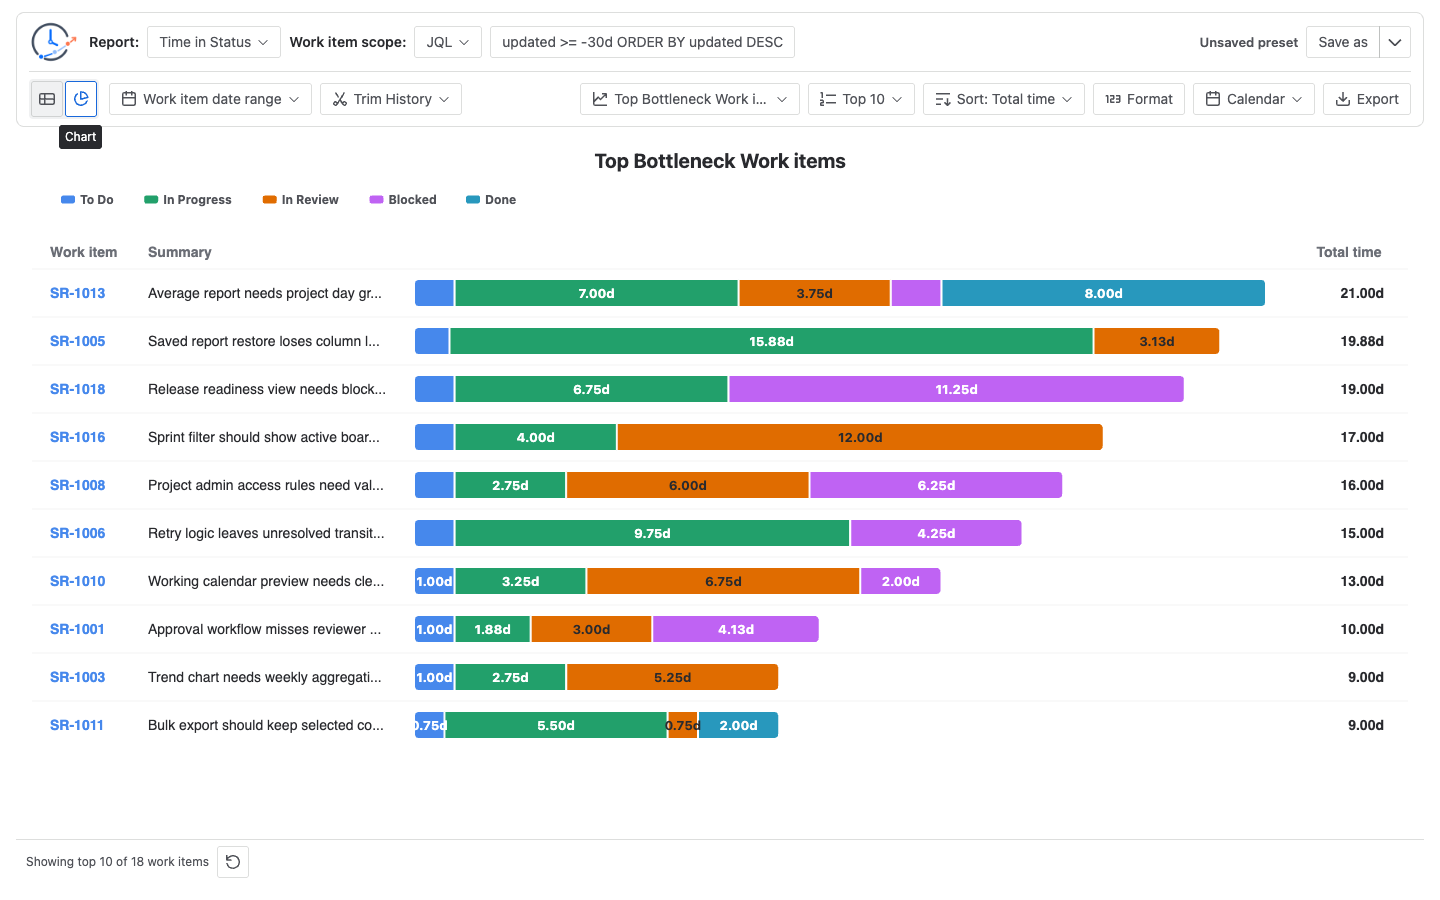
Use it to answer questions such as:
- Which work items spent the most total time?
- Which work items spent the longest time in Blocked?
- Which work items are driving the biggest status-time bottleneck?
Each row is a work item. The bar length represents the selected duration measure. The colored bar segments show how that work item’s time is distributed across statuses. The legend maps each color to a status.
Use Top N to choose how many work items to show. Current options are Top 5, Top 10, Top 20, and Top 50.
Use Sort to rank by Total time or by a specific status column from the current report result. If you sort by Blocked, the chart ranks work items by their Blocked duration while still showing their status breakdown.
Status Time Trend
Status Time Trend shows how Time in Status changes across time buckets.
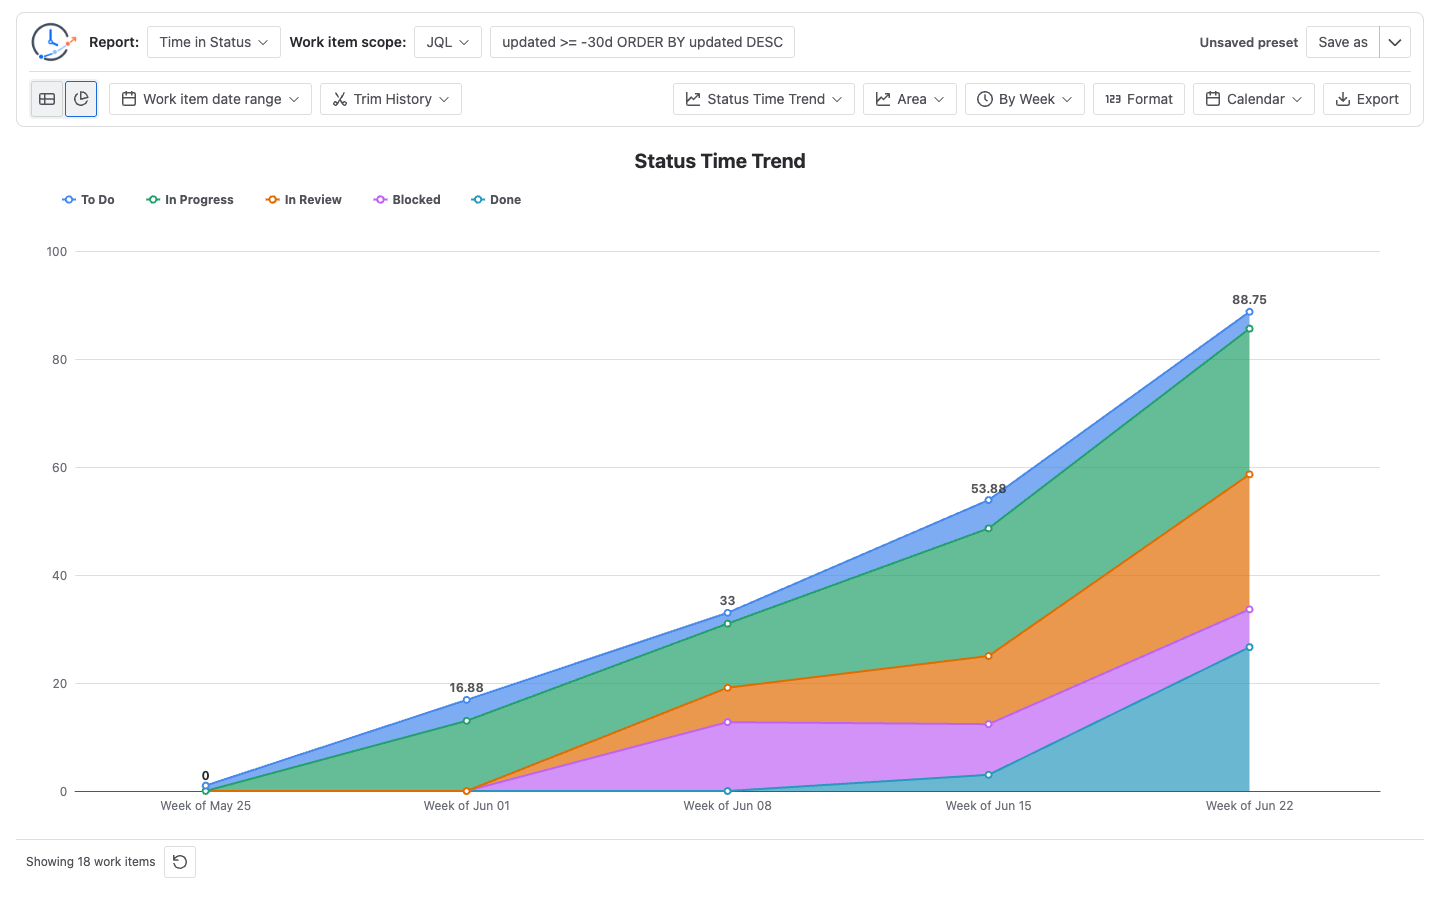
Use it to answer questions such as:
- Is work spending more time in a specific status over time?
- Did a bottleneck appear in a recent period?
- Which statuses dominate the total status time?
For Area and Column views, the x-axis is time. The interval can be Day, Week, Month, Quarter, or Year. The y-axis is duration in the selected chart duration unit. The legend maps each series to a status.
For Pie view, the chart summarizes the status totals for the current report result instead of showing time buckets. The interval control is hidden for Pie view.
For a recurring management review, use the weekly Jira workflow report example to preserve the scope, contributor count, action list, and decision alongside the trend.
Cross-report trend
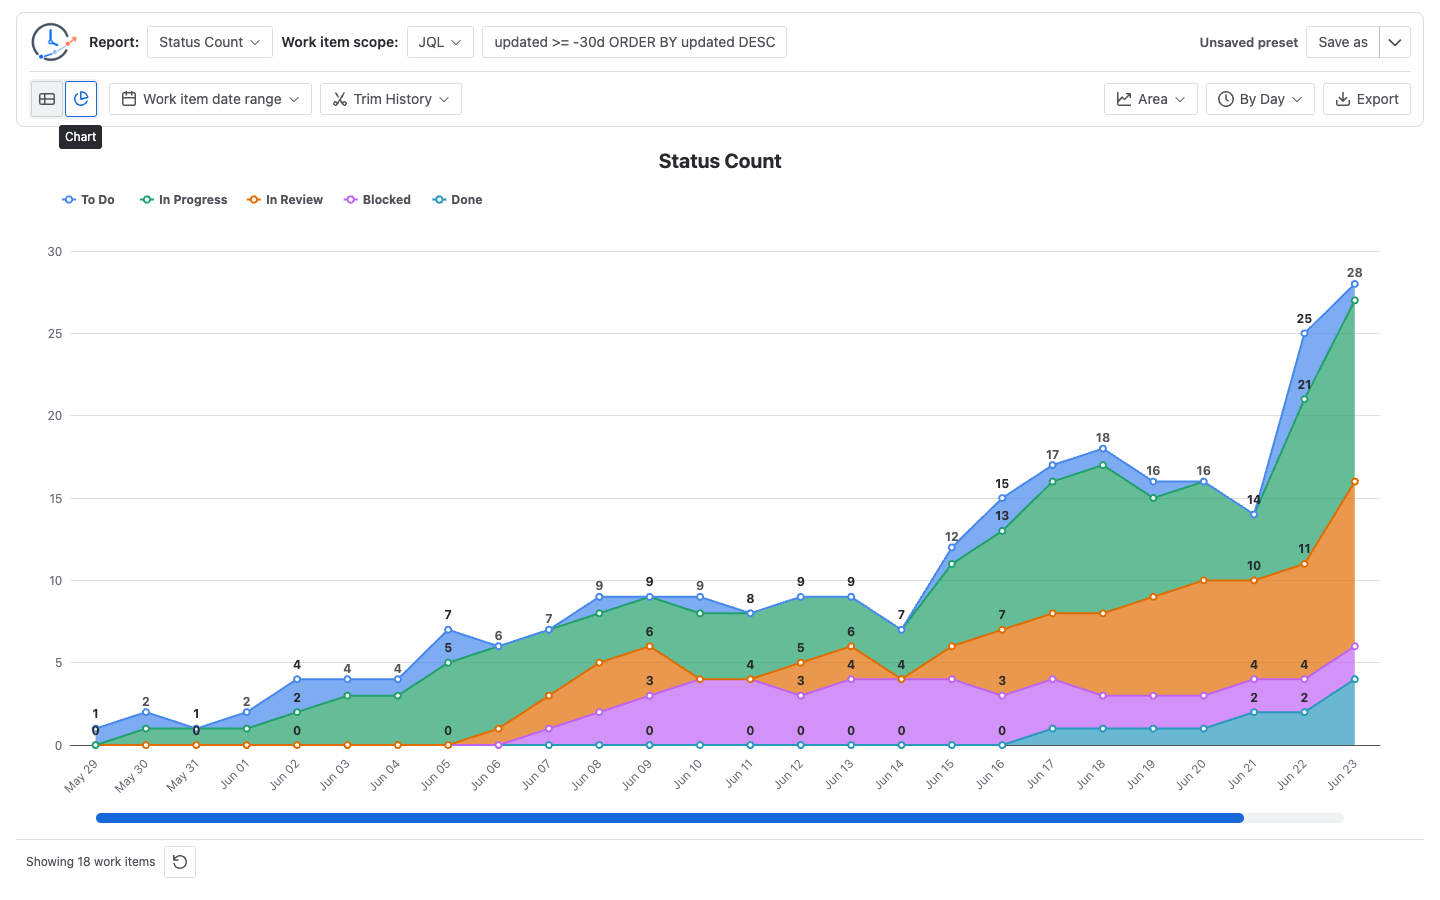
Average Time in Status, Status Count, Status Entry Date, Transition Count, and Time in Assignee use a shared trend chart in Chart view.
| Report type | What the trend measures |
|---|---|
| Average Time in Status | Average duration by status. |
| Status Count | Status entry counts. |
| Status Entry Date | Work item counts by first status-entry date bucket. |
| Transition Count | Transition counts. |
| Time in Assignee | Assignee duration. |
For Area and Column views, the x-axis is time bucketed by Day, Week, Month, Quarter, or Year. For Pie view, the chart summarizes the current result totals.
The legend is based on the current report columns. For Time in Assignee, legend entries represent assignees. For Transition Count, legend entries represent transitions. For status-based reports, legend entries represent statuses.
Format and Calendar effects
Duration charts use the current Format and Calendar behavior where those controls are available. This affects Time in Status, Average Time in Status, and Time in Assignee duration values.
Status Count, Status Entry Date, and Transition Count do not use duration Format or Calendar controls in the current report UI. Their charts show counts or dates derived from the report data.
Chart export
Use Export while in Chart view to download the current chart. Chart export supports PNG, PDF, and SVG.
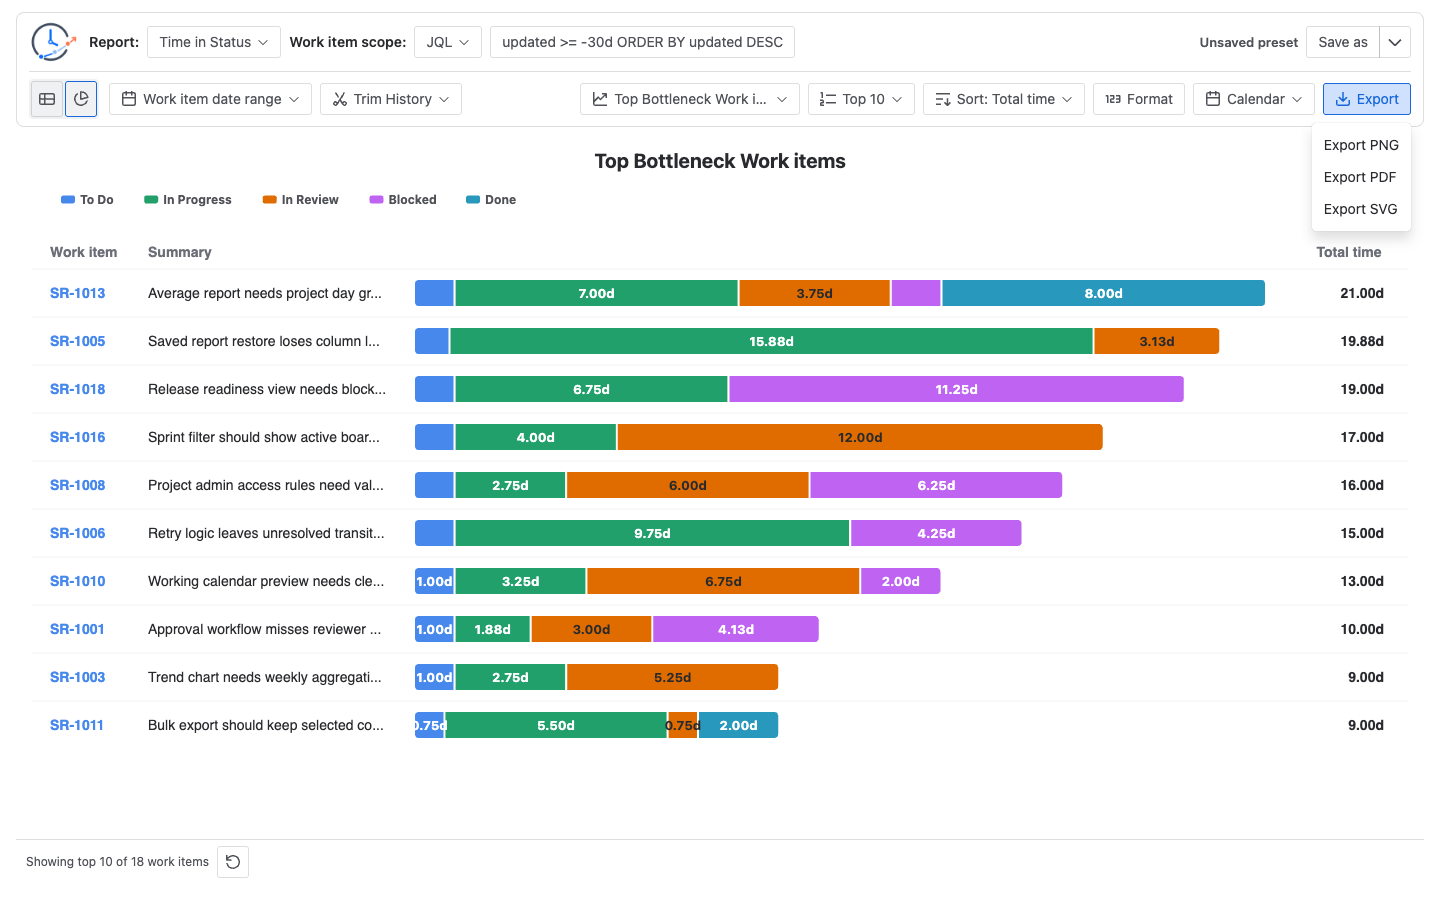
Chart export is separate from table export. It exports the current visual chart, including the chart title. Use Export when you need CSV or XLSX table data.
If you need a formal report pack, verify the downloaded chart file in your Jira site before sharing it.
Why a chart may be empty
- The report has no rows.
- The selected report type does not have a chart for the current data.
- The selected status, assignee, transition, or metric has no values.
- Work item date range or Trim History removed the relevant data.
- Time in Assignee has no assignee history values.
- Status Entry Date has no valid first-entry dates for the visible status columns.
- Chart data is still being prepared; wait for the loading state to finish before exporting.