
Dashboard Gadget
Dashboard Gadget adds a compact StatusPath Reports view to a Jira dashboard. It is for teams that want a fixed report visible beside other dashboard information, such as a status bottleneck table or a chart for a commonly watched work item scope.
Use the main report page when you need to explore data, change setup often, manage saved report presets, or work in a larger table and chart workspace.
What the gadget is for
Use the gadget for a recurring dashboard view. A good gadget setup answers a question that a team wants to check repeatedly, such as:
- Which active work items are spending the most time in Blocked?
- How much time is currently sitting in review?
- Which work items have repeated status transitions?
- How does a known JQL scope look this week?
The gadget is not the main report page embedded inside a dashboard. It uses a compact layout, stores configuration with the dashboard gadget, and is best for stable report views rather than ongoing report design.
Where it appears
Add the StatusPath Reports gadget from a Jira dashboard. After the gadget is added, configure its Report setup and save it. The dashboard tile then renders the configured report.
The gadget result can be opened later from the same dashboard. Use the Settings icon in the gadget toolbar to change the configuration.
Basic workflow
- Open a Jira dashboard.
- Add the StatusPath Reports gadget.
- Choose the report type and work item scope.
- Configure date and history filters.
- Choose a Work schedule for duration reports.
- Save the gadget configuration.
- Review the compact table or chart on the dashboard.
Gadget setup
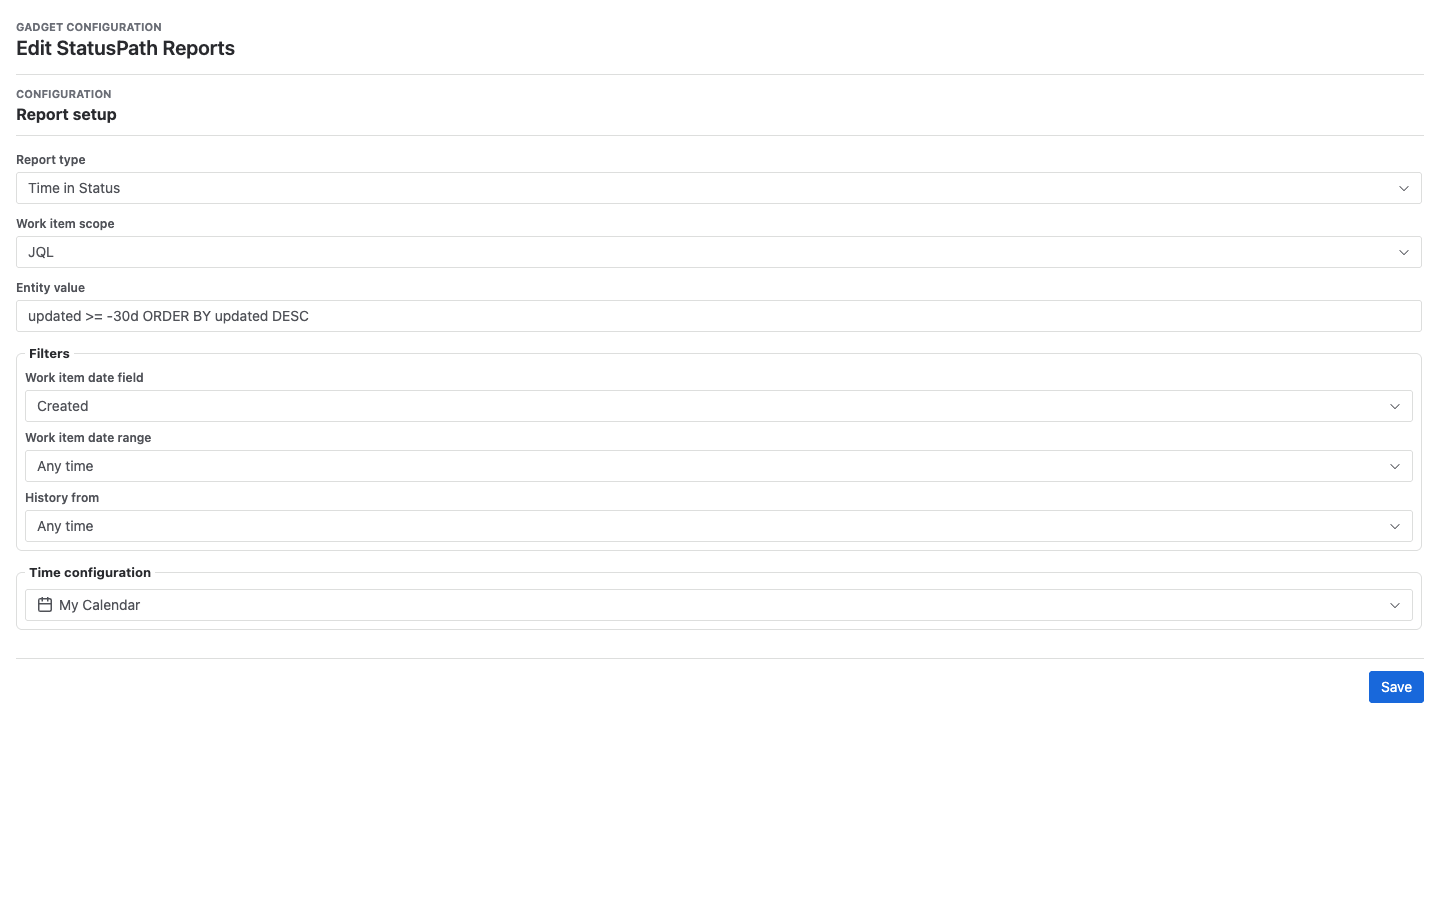
The setup screen is intentionally smaller than the main report page. It focuses on the configuration needed to run one dashboard report.
Report type
The current gadget setup uses the same normal report type choices as the main report selector:
- Time in Status
- Average Time in Status
- Time in Assignee
- Status Count
- Status Entry Date
- Transition Count
Count and date reports do not need duration controls. Duration-style reports can use a Work schedule.
Work item scope
The gadget supports the same core work item scope types used by the main report:
- Project
- Saved filter
- JQL
- Sprint
- Epic
Sprint setup requires both a board and a sprint. JQL is validated before the gadget configuration is saved.
Choose a narrow, stable scope for dashboard use. Broad scopes can make the gadget slower to load and harder to read in the limited dashboard space.
Date and history filters
The gadget setup separates work item filtering from history calculation:
- Work item date field chooses which work item date is used for the date filter, such as Created, Updated, or Resolved.
- Work item date range controls which work items are included in the report.
- History from controls how far back the status or assignee history calculation should look.
Do not use History from as a replacement for work item scope. A work item must first be selected by the scope and work item date filter before history trimming affects its calculation.
Work schedule
Work schedule appears for duration reports. It controls which working calendar is used for duration calculation.
Status Count, Status Entry Date, and Transition Count do not show this time configuration because they are count or date reports.
Average grouping
When configuring Average Time in Status for a table-style gadget, the setup can include Group by controls. Use those controls when the dashboard needs an average broken down by a field and time bucket.
For deeper group and column work, use the main report page.
Reading the gadget result
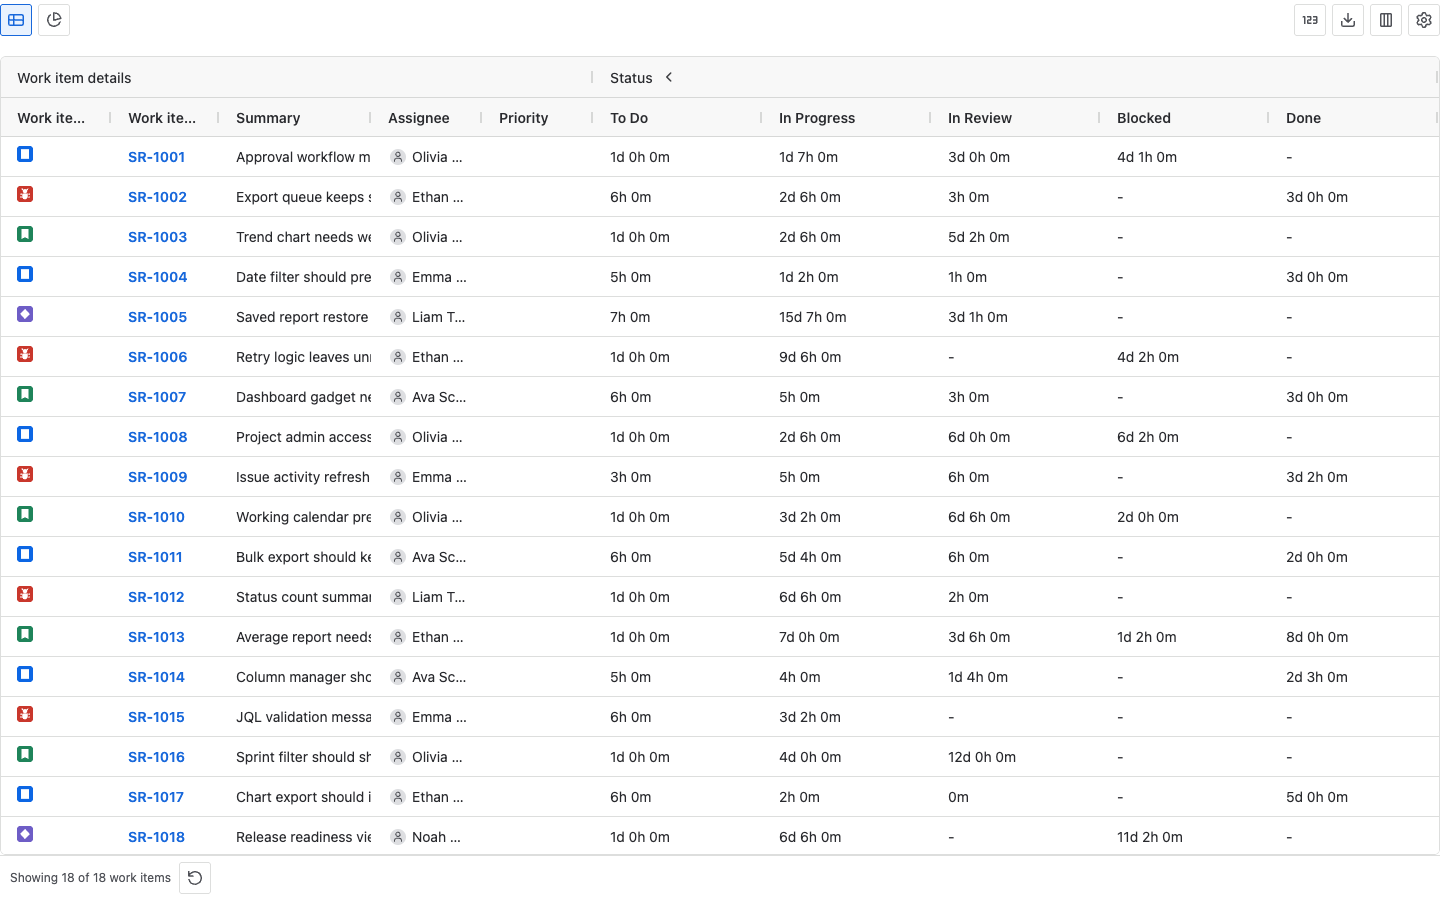
The gadget result uses a compact report workspace.
In table view, the gadget shows report rows in a grid. The toolbar includes compact actions for table/chart view, duration Format where relevant, export, columns, and settings. The footer shows how many work items are displayed and includes a Refresh control.
In chart view, the gadget shows the chart supported by the selected report type and data. Chart controls are compact so they fit in the dashboard tile.
If the selected report or current data cannot produce a chart, switch back to Table view.
How it differs from the main report page
| Area | Dashboard Gadget | Main report page |
|---|---|---|
| Location | Jira dashboard tile. | StatusPath Reports main app page. |
| Best use | Fixed, recurring dashboard view. | Building, exploring, saving, and exporting reports. |
| Configuration | One compact setup stored with the gadget. | Full report setup with saved report preset workflow. |
| Work item scope | Project, Saved filter, JQL, Sprint, or Epic for this gadget. | Same scope types, with more space for review and iteration. |
| Table | Compact grid in dashboard space. | Full AG Grid workspace for wider inspection. |
| Charts | Compact chart view where supported. | Full chart page with broader chart controls. |
| Saved reports | No Saved reports menu in current gadget setup. | Save, restore, update, rename, copy, and delete presets. |
| Best troubleshooting path | Check setup, permissions, dashboard context, and refresh. | Rebuild the report in the main report page to inspect details. |
Empty data and refresh issues
If the gadget is empty or does not show the expected result, check these areas:
- The selected Project, Saved filter, JQL, Sprint, or Epic may return no work items for the current Jira user.
- The work item date range may exclude the work items you expected.
- History from may remove the changelog period needed for the selected report.
- The current user may not have permission to see some work items or their changelog data.
- JQL must be valid before the gadget setup can be saved.
- A count or date report will not show duration controls because those settings are not used by that report.
- Chart view may be empty when the selected report or data does not have a supported chart result.
- The dashboard result may need Refresh after changing the configuration or after Jira data changes.
When troubleshooting is unclear, recreate the same report setup on the main report page. The larger workspace makes it easier to inspect scope, rows, columns, charts, and export behavior before deciding what belongs on a dashboard.
For a focused recurring Review queue, follow How to Monitor Jira Workflow Bottlenecks with a Dashboard Gadget and treat the compact result as an investigation signal rather than a diagnosis.
If Jira’s native Average Time in Status status picker is broader than the intended Project or Filter, use a source-to-history-to-column acceptance test to verify the returned keys, fresh dynamic columns, manual average, and this gadget’s saved configuration separately.