
Issue Drill-down and Work Item Status Journey
Issue drill-down connects an Average Time in Status group in Report Center to the participating work items behind its Work item count. From that list, Work item status journey explains how one participating work item moved through its statuses.
Where you can open a drill-down
| Surface | Starting point | What opens |
|---|---|---|
| Report Center, Average Time in Status table | Use the action in a Work item count cell, then choose a participating work item. | A participating-work-item table, followed by the complete nested Work item status journey. |
In the participating-work-item table, the work item key opens the Jira work item. Use the adjacent status-journey action when you want the StatusPath explanation without leaving the report.
Trace an Average group to its work items
Average Time in Status shows one row per group. Work item count identifies how many distinct work items participate in that row, and the percentage compares that count with the total work-item population in the current report.
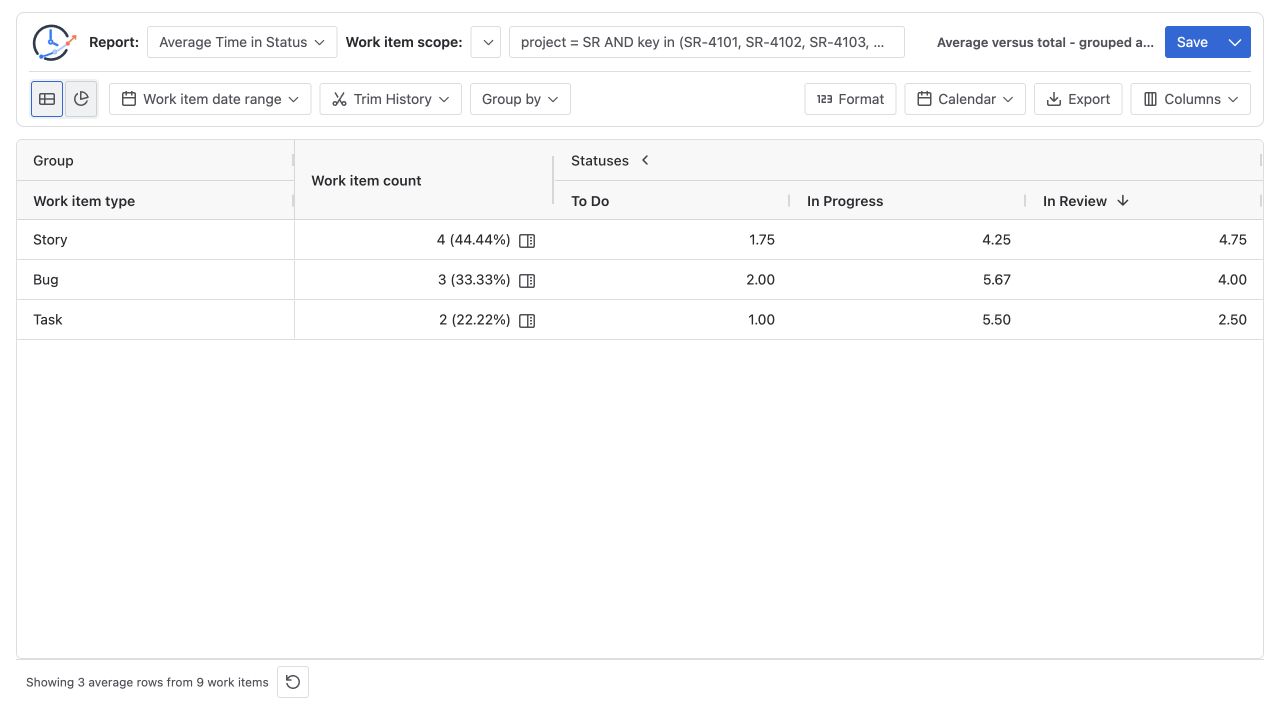
In the example, Story contains 4 of 9 report work items, so the count displays 4 (44.44%). The percentage is descriptive; numeric sorting still uses the count.
The percentage is not always a partition
For a single-value grouping such as Work item type, each work item normally belongs to one row and the row percentages can add to 100%.
Multi-value Jira fields are different. If a work item has both Backend and Urgent, it can participate in both group rows. StatusPath counts that work item once inside each individual row, but it is still present in more than one row. As a result:
- One row never duplicates the same work item in its participating list.
- Counts across different multi-value rows can overlap.
- Row percentages can add to more than 100%.
- The percentage must not be interpreted as an exclusive pie-share unless the grouping field is mutually exclusive.
The row’s Work item count is also not the denominator for every status average. A group can contain four work items while only three have a qualifying contribution to a particular status. In the participating table, a status-column tooltip identifies that status denominator.
Open the participating-work-item table
Use the drill-down action in the Work item count cell. The detail opens with the selected group, the participating count, and one row for each participating work item.
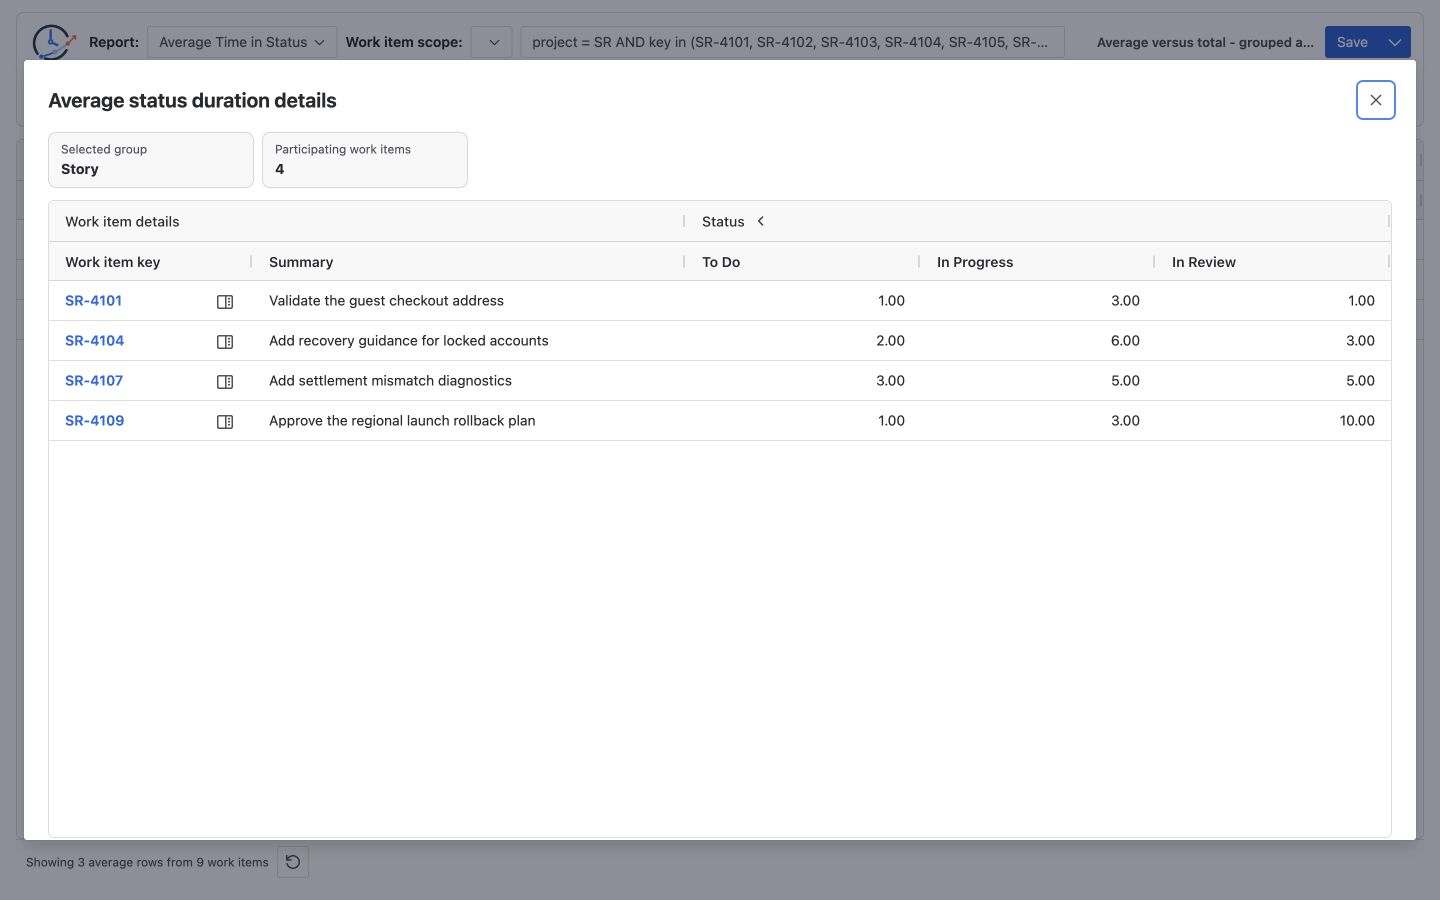
The participating rows are derived from the retained source snapshot for the report result. Opening this first level does not reselect the report population from Jira. This keeps the list tied to the group value you clicked.
The snapshot boundary has practical consequences:
- Jira changes made after the report run are not automatically added to or removed from the open participating list.
- A date-bucket group includes only the contribution that belongs to the selected bucket.
- Group fields and status contributions reflect the report result that produced the Average row.
- Run or refresh the report before investigating when you need a new Jira population and a new snapshot.
Open one participating work item’s journey
Use the status-journey action beside a participating work item. This second level has a different data boundary from the list: it starts a separate load for that one work item’s current details, complete accessible changelog, and workflow status metadata.
Fetching one work item can require more than one Jira API page when its changelog is long. It is therefore possible for the snapshot-backed participating list to open successfully while the nested journey is unavailable, or for current work-item details to have changed since the report was calculated.
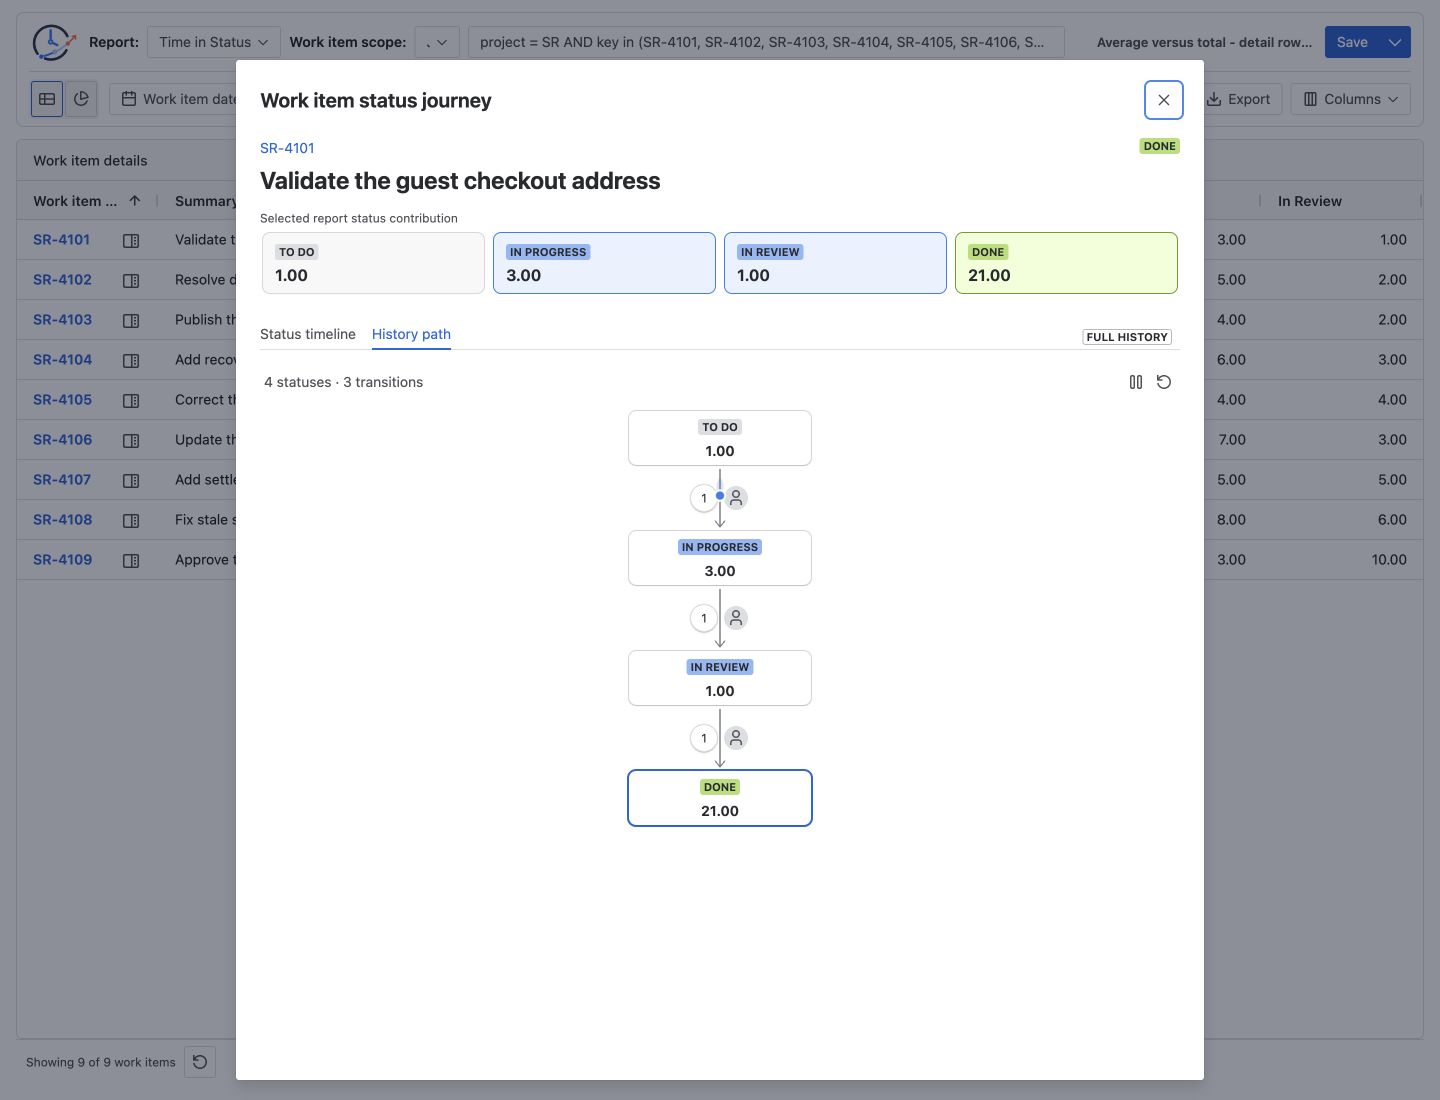
Selected report status contribution and Full history answer different questions
The complete journey deliberately keeps the report result and the lifecycle context separate.
| Area | Data boundary | Use it for |
|---|---|---|
| Selected report status contribution | Values retained for the selected report row. It follows the report’s selected statuses and groups, Calendar, report population, time bucket where applicable, and Trim History calculation. A status omitted from the report can still appear in Full history. | Reconciling the work item with the table or the selected Average group. |
| Selected group contribution | The same report-scoped idea inside an Average group drill-down. It shows the selected work item’s contribution to that group. | Explaining how the item contributed to the aggregate row you opened. |
| Status timeline | The work item’s accessible status history, ordered by time and ending at the report generation time. | Reviewing each status interval, its duration, entry and exit time, and the actor for the entering transition when available. |
| History path | The same full status history collapsed into status nodes and directed transition paths. Repeated visits and transitions are aggregated. | Seeing loops, repeated transitions, current-at-report-time status, and the overall route through the workflow. |
FULL HISTORY means the status history is not clipped by the report’s Trim History range. It does not mean future changes are included: the journey ends at the report generation time.
Trim History boundary
Trim History can make selected report status contribution shorter than the durations in Status timeline or History path. In version 2.5:
- The report row, Average group, participating snapshot, and contribution cards use the report calculation boundary.
- The
FULL HISTORYStatus timeline and History path do not apply the report’s Trim History start or end. - The full-history durations still use the journey’s duration context, such as the report Calendar and Format.
Use the contribution cards and report table to validate a trimmed metric. Use Status timeline and History path for lifecycle context. Do not expect the full-history node totals to equal a Trim History result.
Read the Status timeline
Status timeline shows status intervals in chronological order. Each interval can include:
- Status name and calculated duration.
- Entered and exited date and time.
- The Jira actor associated with the transition into that interval, when Jira supplies one.
- Ascending or descending ordering for review.
The first interval has no preceding status transition inside the history model, so its actor can be shown as —. Actor means the user recorded on the Jira status-change history; it is not the work item’s assignee.
Read the History path
History path turns the same timeline into a workflow graph:
- A status node combines repeated visits to that status and shows their accumulated duration.
- A directed connection shows movement from one status to another.
- A connection count greater than one identifies a repeated transition.
- Transition details depend on the changelog events Jira returned.
- Playback and replay controls help follow the path in event order.
Report Center presentation
The nested Average journey uses the complete presentation: work item identity, current status, selected group contribution cards, Status timeline, and History path. This aggregate-to-participant-to-journey path is specific to Report Center.
Permissions, changelog actors, and changing Jira data
Drill-down does not override Jira permissions.
- The report and its snapshot contain only work items and fields available when the report ran.
- The nested journey must be able to load that one work item and its changelog for the current user.
- Issue security, project permissions, changelog availability, deleted users, privacy controls, and Jira API responses can limit identity or history details.
- A missing actor can appear as
Unknown user; an interval without an entering transition can show—. - The current work item status or summary can differ from the snapshot if Jira changed after the report run.
If the snapshot list and the journey appear to disagree, record the report generation time, refresh the report, confirm the current user, and compare the same work item and history boundary.
Common questions
Why does a work item appear in more than one Average row?
The selected Group by field may be multi-value. One work item can legitimately participate in every matching value or value combination.
Why do the row percentages add to more than 100%?
The rows overlap when grouping by multi-value fields. Each percentage uses the report’s total work-item population as its denominator; the rows are not forced into exclusive categories.
Why does Full history show more time than Report contribution?
The report may use Trim History or a time bucket. Report contribution follows that calculation, while Status timeline and History path remain full history up to report generation.
Why can I see a participant but not open its journey?
The participant came from the retained report snapshot. Opening the journey performs a separate current load for that one work item. Its permission, issue-security, or changelog availability may have changed.
Why is an actor missing or shown as Unknown user?
Jira may not return an actor identity, the user may no longer be available, or the current user may not be allowed to see the identity. The first timeline interval also has no entering transition actor.
Related Guide
How to Trace a Jira Work Item That Moves Back and Forth Between Statuses applies the report-contribution, Full history timeline, History path, and Jira History boundaries to one reproducible investigation.
Finished evaluating the Average drill-down?
Tell BlueGrove Labs what was clear, confusing, or missing. The email opens with three short prompts and does not require a support-portal login.