
Export
Use export when you need to review a report outside StatusPath Reports, share a point-in-time table result, or continue analysis in a spreadsheet.
This page covers table export. Chart export is separate and is covered in Chart view.
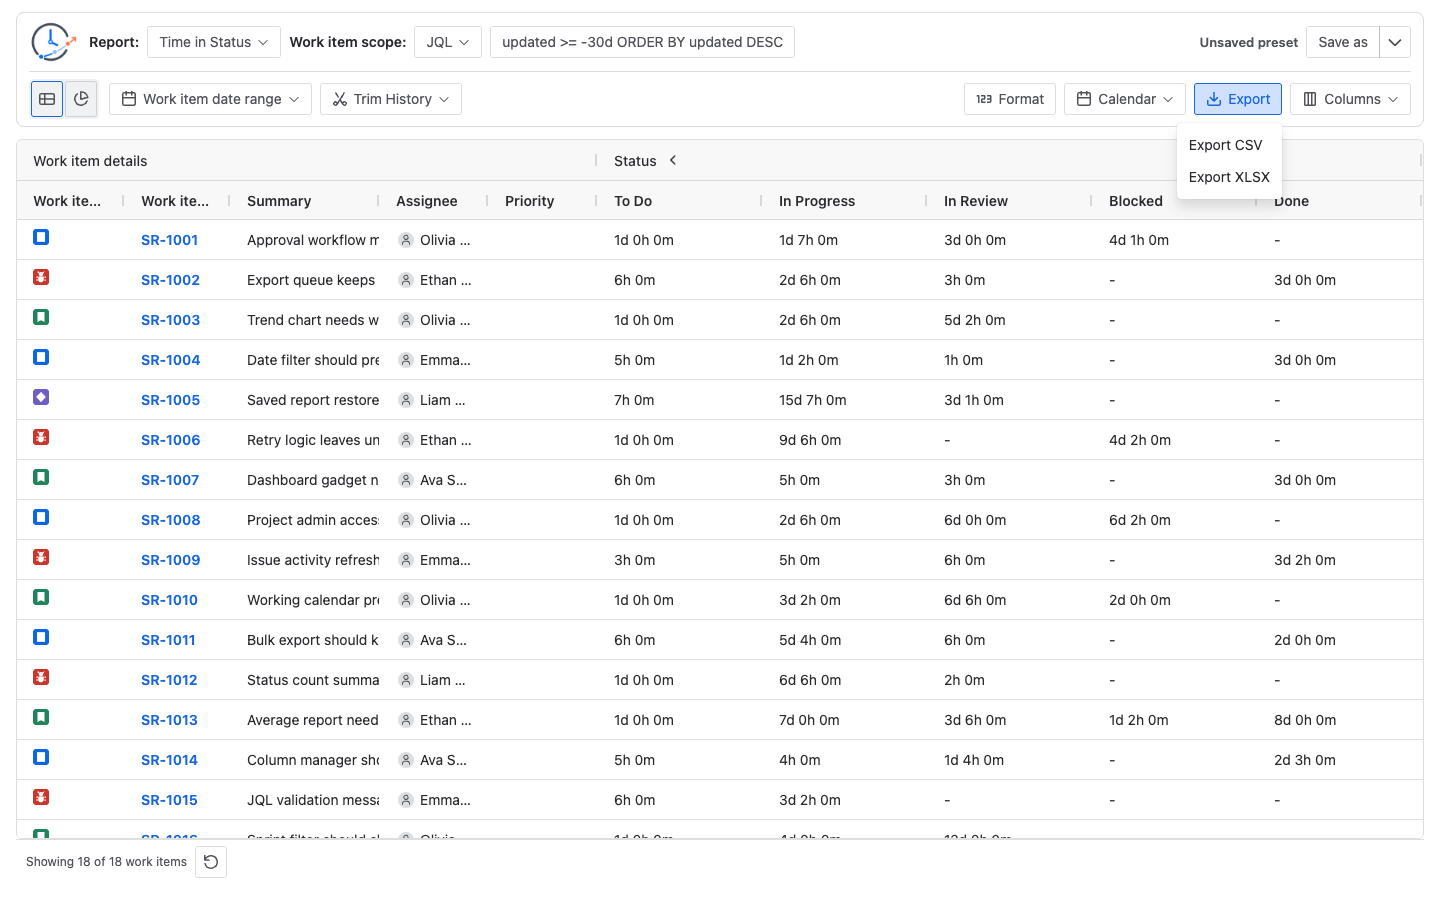
When to export
Export is useful when you want to:
- Share report rows with someone who will not open the app.
- Compare results in a spreadsheet.
- Attach report output to a team discussion.
- Keep a point-in-time copy of the report result.
- Do additional grouping, formulas, or pivot-style analysis outside Jira.
Export does not replace saved reports. A saved report stores reusable setup. An exported file stores file output from one run.
Export formats
CSV
CSV is a lightweight text format. Use it when you want to import the report into another tool, inspect rows quickly, or keep the file small.
CSV output includes a header row and one row per exported table row. To reduce spreadsheet formula injection risk, StatusPath escapes text values that begin with =, +, -, or @ and could be interpreted as formulas before download. The literal - missing-value marker is left as data. This is a limited safeguard, not protection against every spreadsheet application or downstream conversion risk.
XLSX
XLSX is better when the file will be opened directly in Excel-compatible tools.
The current XLSX export builds a workbook with:
- A frozen header row
- Column widths based on the table/export column metadata
- Header styling
- Duration and total-value styling
- Status styling for current status columns where available
- Work item key hyperlinks where the app can build a Jira work item URL
- A sanitized sheet name
XLSX formatting is intended to make the file easier to read. It is not a full recreation of the interactive AG Grid table.
What data is exported
For per-work-item reports, table export uses the current report configuration, then loads the complete report result for that configuration before building the file. The interactive table may initially load 50 rows, but export is not limited to those rows or to the browser viewport.
Average Time in Status is the exception: the main report has already calculated grouped rows for the selected scope, so export uses the current calculated grouped table rows instead of invoking the per-work-item full-result loader again.
The file reflects the current report setup, including:
- Report type
- Work item scope
- Work item date range
- Trim History
- Selected Calendar
- Duration Format
- Selected fields and columns
- Status, assignee, transition, or group columns that exist for the report
- Current supported table filters and sorting
- Average Time in Status group-by settings
If a supported table filter or duration filter removes rows from the result, the export follows the filtered result. If supported sorting changes the result order, the export follows that order.
Columns and hidden fields
Export follows the current table column configuration.
If you hide a column in the table, it does not appear in the exported table file. If you reorder columns, the exported file follows the current column order. A dynamic status, assignee, transition, or group column with no values in the current result may be omitted from export.
Use Columns before exporting when you need a specific file layout.
Duration values
Duration values are exported using the current report Format and Calendar behavior.
For duration reports, this affects:
- Time in Status duration columns
- Average Time in Status values
- Time in Assignee values
- Status or assignee group duration values
- Total duration values
For Status Count, Status Entry Date, and Transition Count, exported values are counts, dates, or transition counts rather than duration values.
If exported duration values do not match another tool, check Format, Calendar, Work item date range, and Trim History first.
Export progress
Large exports can take time because the app may need to search work items, load fields, load changelog history, calculate results, and build the file.
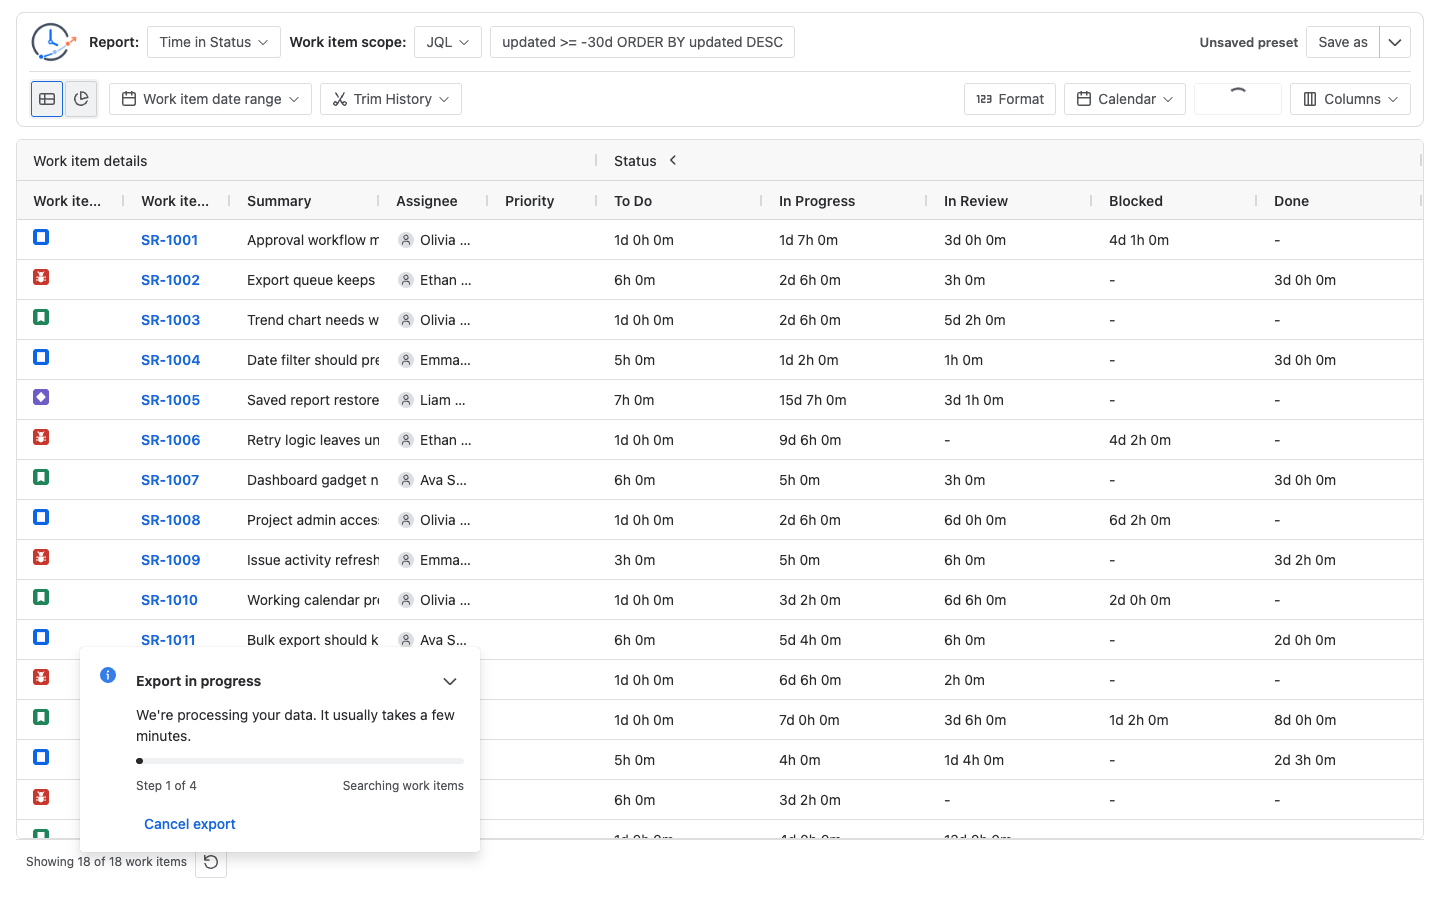
If the export is canceled, the file is not downloaded.
Table export vs chart export
In Table view, Export downloads table data as CSV or XLSX.
In Chart view, Export downloads the current chart image or document format supported by the chart export control. Chart export does not create a CSV or XLSX table file.
Switch back to Table view when you need row-level report data.
Export limits
Do not treat export as unlimited. Very large exports depend on:
- Jira data volume
- Work item history size
- Browser memory
- Jira API behavior
- Network speed
- Report type
- Selected columns and fields
If an export is too slow or fails, narrow the Work item scope, use Work item date range, reduce selected fields, or export a smaller report.
Common export issues
- Export is disabled: wait for the report to finish loading, make sure the table has rows, and check that no export is already running.
- Export is empty: check table filters, duration filters, Work item date range, and Trim History.
- Export takes a long time: the app may be loading the full report result for the current configuration before building the file.
- Export does not download: check whether the browser blocked downloads from the Jira app frame, then retry.
- XLSX opens with fewer columns than expected: check hidden columns and Columns Manager selection.
- Duration values differ from another file: compare Format, Calendar, timezone, Work item date range, and Trim History.
- A work item link is missing in XLSX: the app may not have enough context to build that Jira work item URL in the current runtime.