
Table View
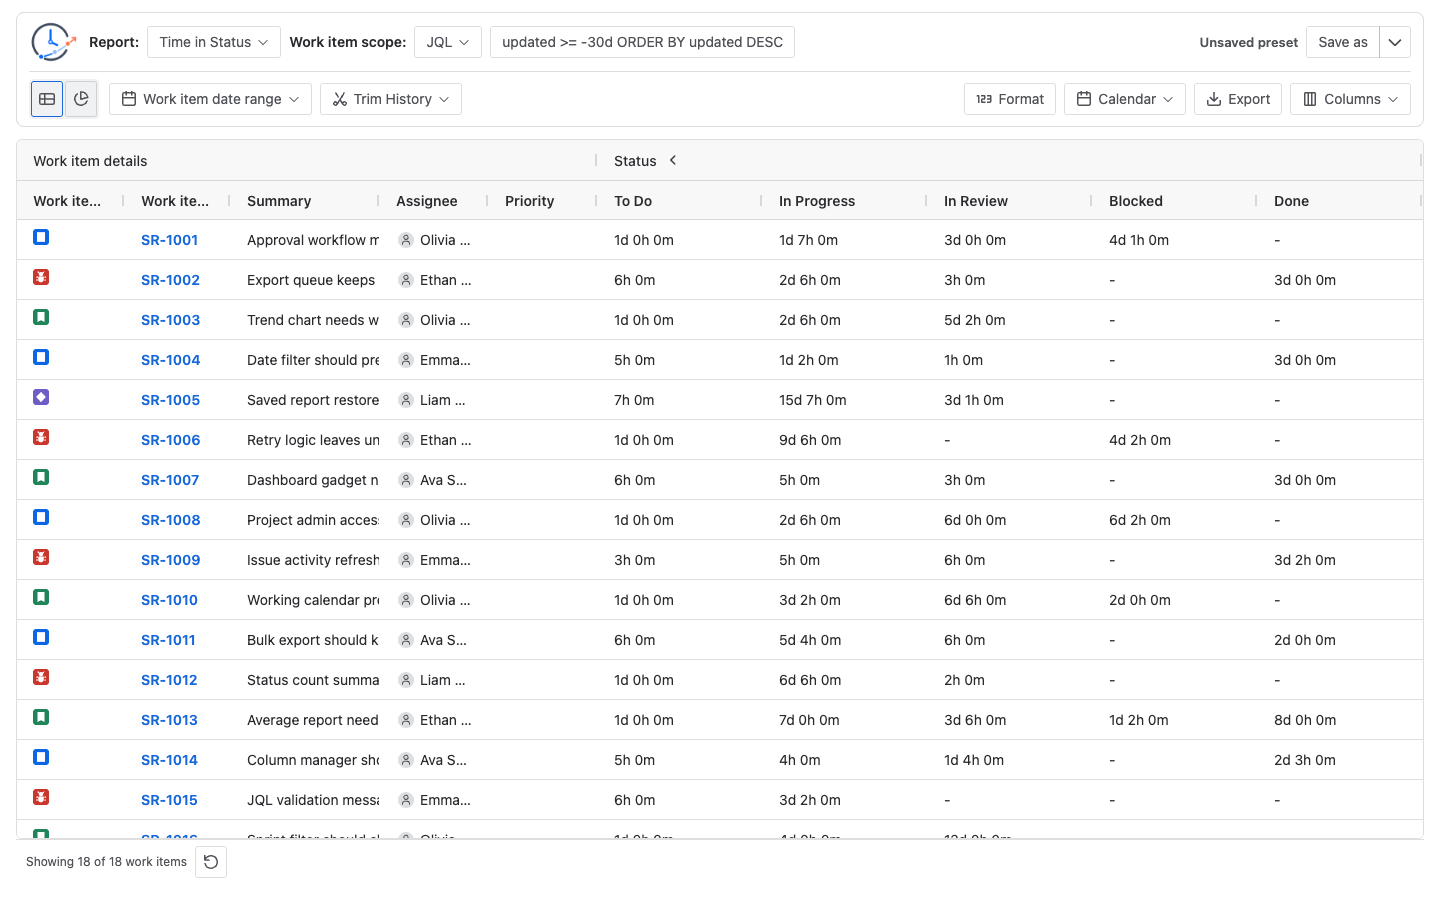
The table is the detailed result view in StatusPath Reports. Use it when you need to inspect individual work items, compare status time across many rows, sort results, filter values, or export the same data later.
Use the table to validate the exact work items and values behind a chart or export.
How to read the table
Most report types show one row per work item. The left side contains work item details such as type, key, summary, assignee, and priority. The right side contains the report result columns.
Average Time in Status is different: it shows grouped average rows instead of one row per work item. In that report, the left side contains the selected grouping fields and a work item count column.
Report result columns are dynamic. A status, assignee, or transition column appears only when the current report data has a value for that column. If a workflow status has no relevant history in the selected data, that status column may not appear.
The metric column group can be expanded or collapsed. When expanded, you see the individual status, assignee, or transition columns. When collapsed, the table shows a total column for the visible metric columns.
Work item detail columns
Work item details identify the row before you interpret the metrics. The default visible fields are:
- Work item type
- Work item key
- Summary
- Assignee
- Priority
Work item key is locked because it is the main link back to Jira. Other fields can be removed or reordered.
The built-in fields also include Current status, Reporter, Created, Updated, and Resolved. You can search for additional Jira fields from Columns Manager. Field availability depends on the Jira fields that the app can read in the current site and work item data; do not assume every Jira field type will display exactly like it does in Jira.
Dynamic report columns
| Report type | Dynamic columns |
|---|---|
| Time in Status | Status duration columns. |
| Average Time in Status | Average duration columns by status. |
| Time in Assignee | Assignee duration columns. |
| Status Count | Status entry count columns. |
| Status Entry Date | First status-entry date columns. |
| Transition Count | From-status to to-status transition columns. |
If a status, assignee, or transition does not appear, confirm that the selected work items have relevant history and that the column is selected.
Interactive issue drill-down
In version 2.5, one Average Time in Status table cell can open issue-level detail:
- In an Average Time in Status table, use the action in a Work item count cell. It opens the distinct work items participating in that group; each participating row can then open its Work item status journey.
Average Work item count displays count (percentage), where the percentage uses the current report’s total work-item population. Sorting remains numeric by count. When Group by uses a multi-value field, one work item can participate in multiple rows, so those row percentages can add to more than 100%.
The Average participant list is derived from the report’s retained source snapshot. Opening a nested journey separately loads that one work item’s current accessible details and changelog. See Issue drill-down and Work item status journey before comparing a report contribution with the full-history Timeline or History path.
Sorting and filtering
The table is an AG Grid table, so column headers are interactive:
- Click a header to sort when sorting is available for that column.
- Open a header menu to use available filters.
- Drag column separators to resize columns.
- Use horizontal scrolling when the report has more statuses, assignees, transitions, or Jira fields than fit on screen.
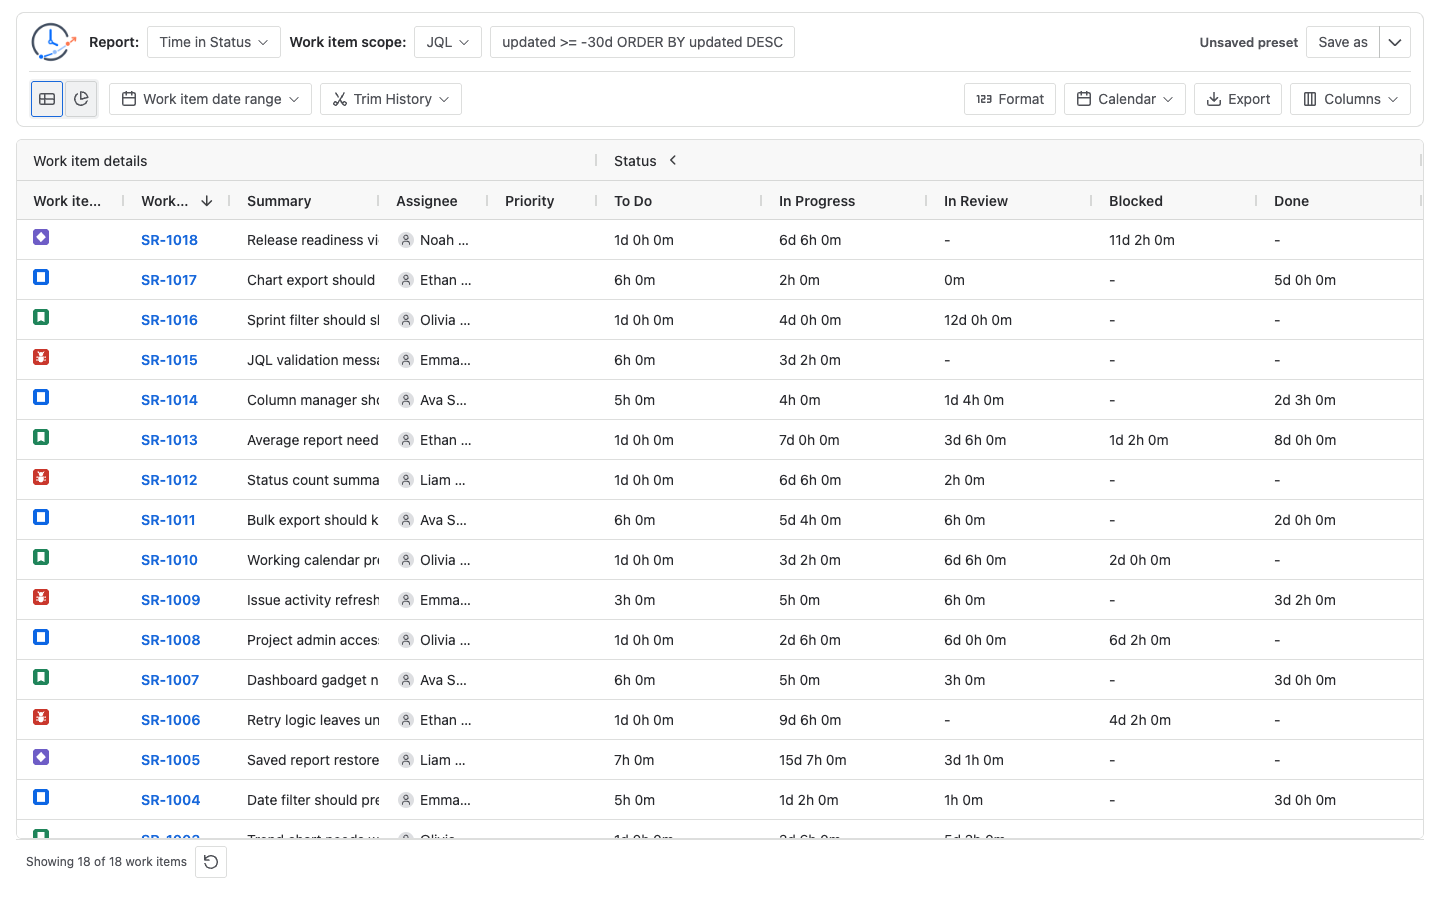
Work item detail columns can be sorted when the app has a supported sort mapping for that field. Duration-like report columns can be sorted by their calculated duration. Status Count and Transition Count columns use numeric sorting and filtering. Status Entry Date columns use date filtering.
Filtering changes the rows shown in the table. For per-work-item reports, export reloads the complete result for the current report configuration and applies supported table filters and sorting; it is not limited to the browser viewport or the initial 50 loaded rows. Average Time in Status exports the current calculated grouped table rows. Review the grid state before exporting.
Duration filtering
Duration columns use a duration filter instead of a plain text filter. The filter supports:
- Equals
- Does not equal
- Greater than
- Greater than or equal to
- Less than
- Less than or equal to
- Between
- Blank
- Not blank
Enter values in the format shown by the filter hint. The accepted input depends on the current duration Format. For example, an elapsed hours/minutes format expects values like 2h 30m, while a decimal-days format expects values like 1.25d.
Horizontal scrolling and dynamic columns
StatusPath Reports builds metric columns from the report result. A project with many workflow statuses, a Time in Assignee report with many assignees, or a Transition Count report with many transitions can create a wide table.
Use horizontal scrolling to inspect columns to the right. Keep the most important work item detail columns visible by removing fields you do not need or moving important fields earlier in Columns Manager.
Dynamic columns also mean screenshots and exports can differ between reports. If two projects have different workflows, they can produce different status columns even when the same report type is selected.
Blank, zero, and dash values
Missing-value display depends on the report type. Duration reports generally use -; Status Entry Date uses a blank cell; visible Status Count and Transition Count columns use numeric 0 when a row has no matching event.
| Value | Meaning |
|---|---|
- | No duration value was calculated for that row and column. For duration reports, this usually means the work item has no recorded entry for that status, assignee, or group in the calculated history window. |
| Blank Status Entry Date cell | The report found no entry for that status in the calculated history window. |
0m, 0:00, 0.00h, or similar zero-duration output | The app found a duration record, but the calculated duration is zero or rounds to zero in the selected Format. This is different from -. |
0 | For a visible Status Count or Transition Count column, no matching entry or transition was counted for that row in the calculated history window. It is a real numeric value, not the generic missing-value display. |
| Empty-looking work item field | Some Jira field values can be unavailable or unsupported for display. In most built-in field renderers, unavailable field values are normalized to -. |
If a value looks unexpected, check both Work item date range and Trim History. The work item can be included in the report while part of its status or assignee history is trimmed out of the calculation window.
Common troubleshooting
- A status column is missing: no current row has a calculated value for that status, or the column was hidden in Columns Manager.
- Duration filters do not match expected rows: confirm the current duration Format, then enter filter values in the same style as the filter hint.
- Table values differ after changing Calendar: business-hours calendars affect duration calculations and can change duration values.
- Export does not include a hidden column: export follows the current table configuration and visible result state.