Getting Started
Use this guide to open StatusPath Reports, choose a work item source, run your first Time in Status report, and understand the main report center controls.
For a first report, start with a small project or a narrow JQL query. A smaller dataset is easier to validate.
When to use this
Use this page when you are new to StatusPath Reports and want to produce a useful report before configuring saved reports, dashboard gadgets, or advanced time settings.
Before you begin
- StatusPath Reports must be installed on your Jira Cloud site.
- You need permission to view the Jira issues you want to report on.
- You should know whether you want to start from a Project, Filter, or JQL query.
Steps
1. Open the app
Open Jira, then open StatusPath Reports from the Apps area or the product entry point configured for your site.
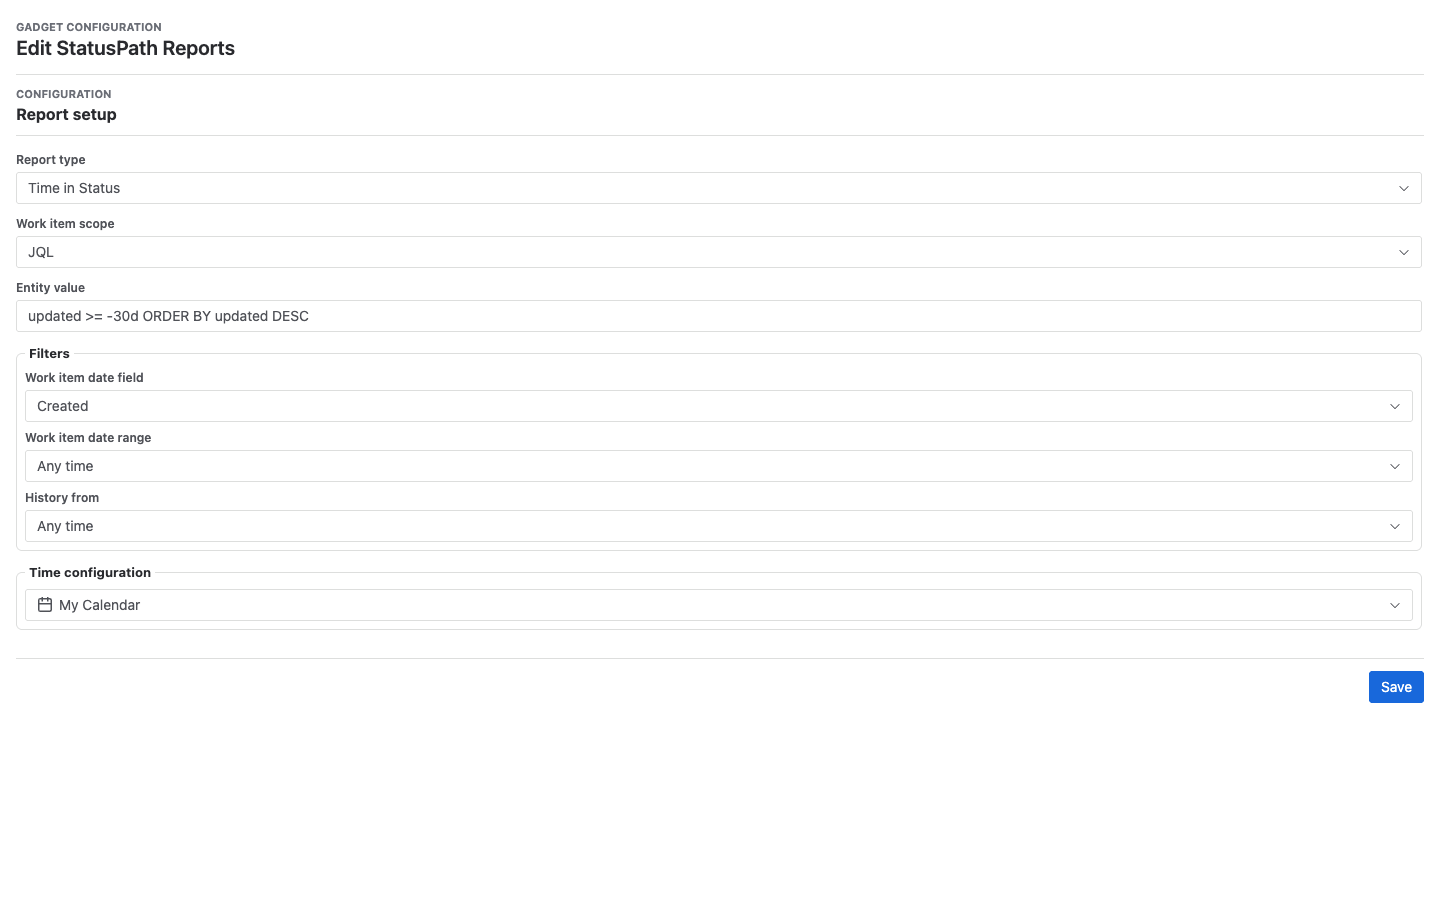
2. Choose a report type
Select Time in Status. This report calculates how long each work item stayed in each workflow status.
3. Choose a work item source
Select Project for a simple first run, or choose JQL if you want a more specific set of issues.
project = "OPS" AND issuetype in (Story, Bug) ORDER BY updated DESC4. Review setup controls
Review Work item range, Trim History, duration format, and work schedule. Work item range controls which issues Jira returns; Trim History clips which parts of each work item’s history contribute to the calculation.
5. Run the report
Review the selected scope, date range, and status options. Then run the report.
6. Review the table
Look for issue rows, issue field columns, and dynamic status columns. Duration values show how long each issue spent in a status.
7. Switch to charts
Open the chart view to review top bottleneck issues or trend charts for the same result set.
Result
You should see a Time in Status table with default work item fields such as work item type, key, summary, assignee, and priority, plus dynamic status duration columns. If chart data is available, the chart view will show bottleneck or trend information for the same report.
Notes
- A report only includes issues the current Jira user can view.
- A narrow JQL query or small project is the best way to validate the first result.
- Duration values may change when business hours or date range settings are applied.
- Use Columns to add Jira fields, choose dynamic status columns, or create custom status groups.
Troubleshooting
If you cannot find the app, confirm that the app is installed and that your Jira administrator has granted access. If a JQL query fails, test the same query in Jira issue search first.