Charts
Charts help you move from issue-level detail to visual workflow patterns. Chart data is calculated from the same report result used by the table, so source, Work item range, Trim History, calendar, and duration format still matter.
Charts are calculated from the same report scope and settings as the table view.
When to use this
Use charts when you need a visual summary for a delivery review, retrospective, support queue review, or process improvement discussion.
Before you begin
- Run a report with enough issues to produce chart data.
- Confirm the report scope and date range.
- Decide whether you need bottleneck or trend analysis.
Steps
- Run a report.
- Open the chart view.
- Choose a chart such as Top Bottleneck Issues or Status Trend.
- Review the longest durations, trend changes, and visible outliers.
- Export the chart if you need to include it in a review deck or internal update.
Result
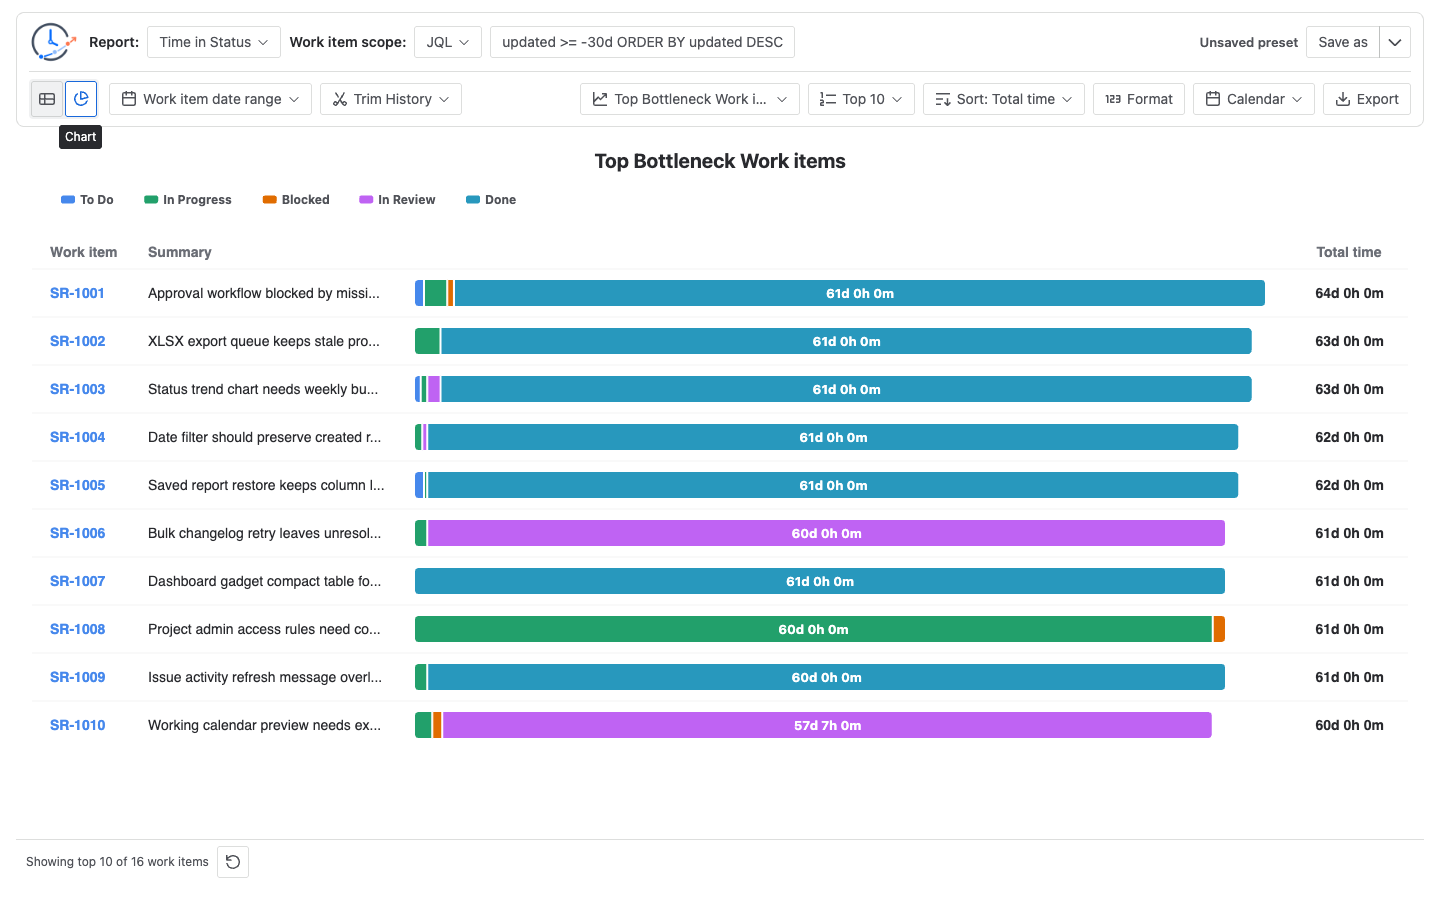
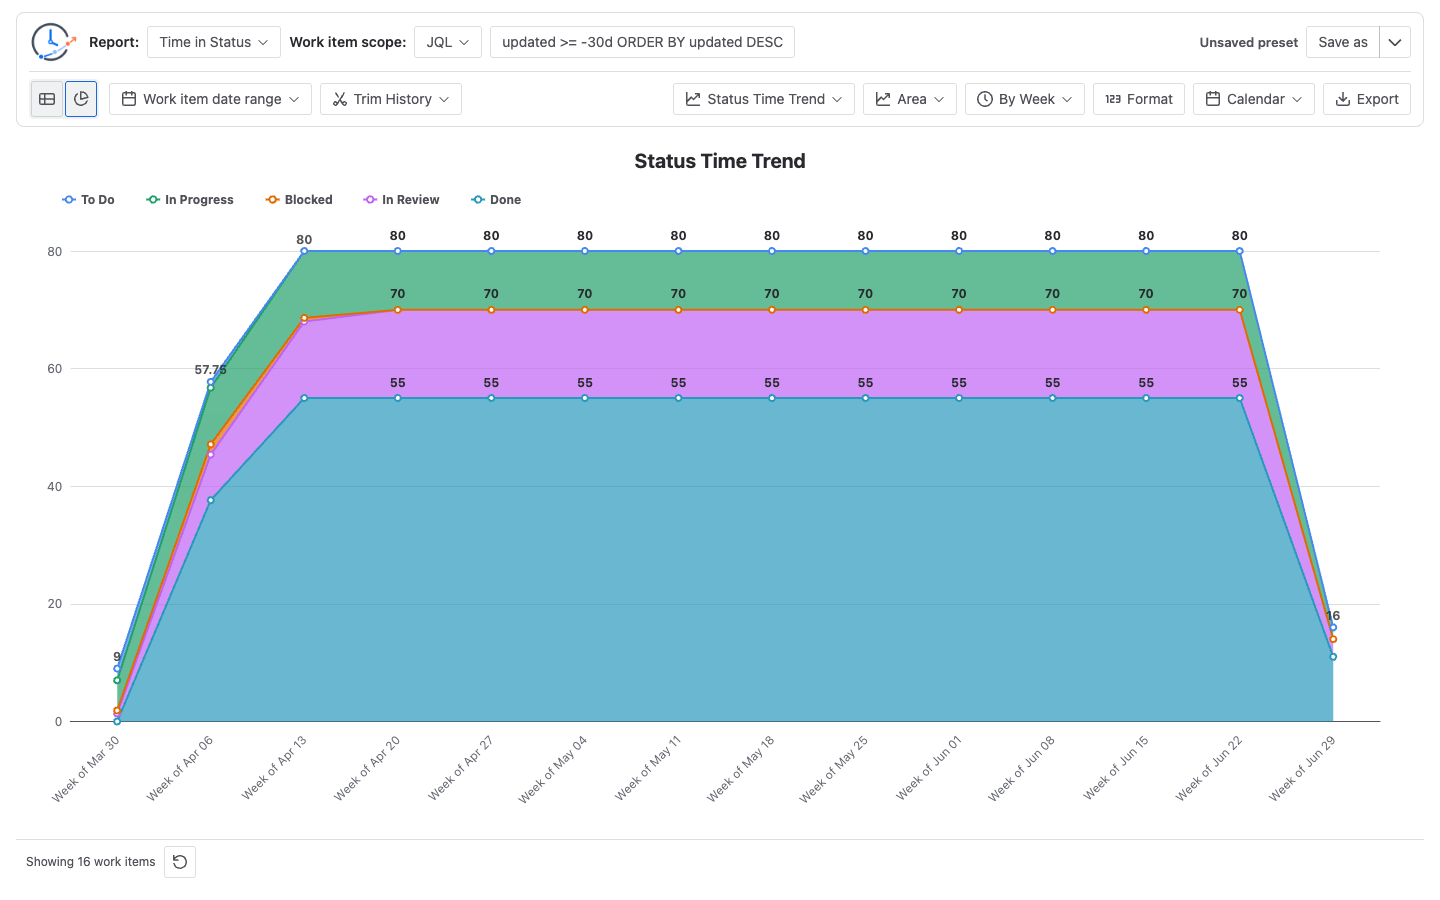
The chart view shows a visual summary of the report result. A bottleneck chart highlights the work items with the largest values. A trend chart shows movement across time buckets.
Notes
Available chart capabilities include:
- Top Bottleneck Issues
- Status Trend
- Cross-report trend charts
- Chart export
Time in Status supports the dedicated Top Bottleneck Work Items chart and Status Time Trend chart. Average Time in Status, Status Count, Status Entry Date, Transition Count, and Time in Assignee use the shared trend chart model where supported by the current report result.
Chart export supports PNG, PDF, and SVG from the chart toolbar where the current chart type provides export actions.
Troubleshooting
If a chart is empty, confirm that the report result contains numeric values for the selected chart. Some charts require a date range, comparable buckets, or enough issues to show a useful result.