
How to Build a Repeatable Jira Review Monitor with a Dashboard Gadget
Keep one repeatable Jira In Review definition visible in a Dashboard Gadget and use its live Top 5 result as an investigation signal, not a diagnosis.
Use a StatusPath Dashboard Gadget after the monitoring definition is agreed: one JQL population, history boundary, Calendar, Format, target status, sort, and Top 5 rule. The repeatable part is that configuration, not a frozen result. Treat concentration among the five displayed positions as an investigation signal, not a bottleneck diagnosis, and move to the full report and Jira History when the signal persists, changes, or needs explanation.
Keep one approved monitoring definition visible
This guide answers: how can a team keep one already-defined In Review monitoring configuration visible on a Jira dashboard, rerun it consistently, and know when the compact signal requires a full investigation?
It does not decide whether In Review is a systemic bottleneck. Use the workflow bottleneck guide for that diagnosis and the longest Time in Status guide when the task is to design a general duration-based review queue. This page owns the narrower operating pattern: pin a fixed definition to a gadget, read its Top 5 signal consistently, and escalate beyond the gadget when needed.
Use the Dashboard Gadget documentation for the current controls. Atlassian explains how to add and customize gadgets on a Jira dashboard. In the current StatusPath release, the v2 edit screen saves the gadget’s own custom reportConfig; it does not offer a Saved Report selector, and the gadget view does not expose the main report page’s Saved Reports menu. The footer Refresh action and Jira dashboard/gadget refresh events both rerun the current query and calculation. There is no configurable timer interval in this release; legacy interval values are ignored.
Reproducible configuration and one observed result
The captured configuration uses this explicit fixture population:
project = SR
AND key in (SR-5301, SR-5302, SR-5303, SR-5304,
            SR-5305, SR-5306, SR-5307, SR-5308)
ORDER BY key ASC
Atlassian’s advanced JQL documentation explains how JQL defines criteria and ordering. Here JQL selects eight named work items; it does not calculate In Review duration. After running the gadget, verify that the result contains exactly eight rows and that all eight are currently In Review. StatusPath then calculates their history-derived In Review duration under the selected Calendar.
The configuration is reproducible; the result is not frozen. At the recorded fixture observation of 2026-07-31 17:00 UTC, each item has entered In Review once and remains there. The selected Calendar counts weekdays from 09:00 to 17:00 UTC with no exceptions.
| Work item | Current status | In Review duration in this gadget result |
|---|---|---|
SR-5301 | In Review | 32h |
SR-5302 | In Review | 24h |
SR-5303 | In Review | 18h |
SR-5304 | In Review | 12h |
SR-5305 | In Review | 8h |
SR-5306 | In Review | 6h |
SR-5307 | In Review | 4h |
SR-5308 | In Review | 2h |
These values are not a benchmark, SLA, recommended threshold, or proof that In Review constrains the workflow. They are one observed result from a fixed configuration.
Configure the compact signal
| Setting | Fixed value |
|---|---|
| Report type | Time in Status |
| Work item scope | The eight-key JQL above |
| Work item date range | Empty |
| Trim History | Off (complete available history) |
| Calendar | Weekdays 09:00–17:00, UTC, no exceptions |
| Format | Decimal Hours |
| Target status | In Review |
| Table sort | In Review, descending |
| Chart | Top Bottleneck Work items |
| Top N | 5 |
| Chart sort | In Review |
Top 5 is a position rule, not an 8h threshold. Sort the eight current gadget-result rows by their In Review duration, then display the first five positions. In this observation those positions are SR-5301 through SR-5305:
Top-five In Review sum = 32h + 24h + 18h + 12h + 8h = 94h
All-eight In Review sum = 32h + 24h + 18h + 12h + 8h + 6h + 4h + 2h = 106h
Raw top-five concentration = 94h ÷ 106h × 100 = 88.679245...%
Displayed concentration = 88.68%
Observed fifth/sixth values = 8h / 6h
The top five work items account for 88.68% of the Review duration displayed by this gadget under the current scope and calculation definition. The denominator is limited to the eight In Review duration values in this gadget result. It is not Total time, all Jira work, all items that ever entered In Review, or a workflow-wide denominator. The 8h value merely occupies fifth place in this observation; it is not a configured cutoff, and the five items are not proven causes of delay.
The current chart orders rows by the chosen duration descending. Equal-duration rows retain their existing result order, and Top N then takes the first five positions. That is a positional truncation rule, not a meaningful tie-breaker. If fifth and sixth are tied, treat them as the same investigation priority and inspect both in the full table. After any rerun, open durations, Jira data, permissions, or history can change, so Top 5 membership and concentration can move even while the gadget configuration stays fixed.
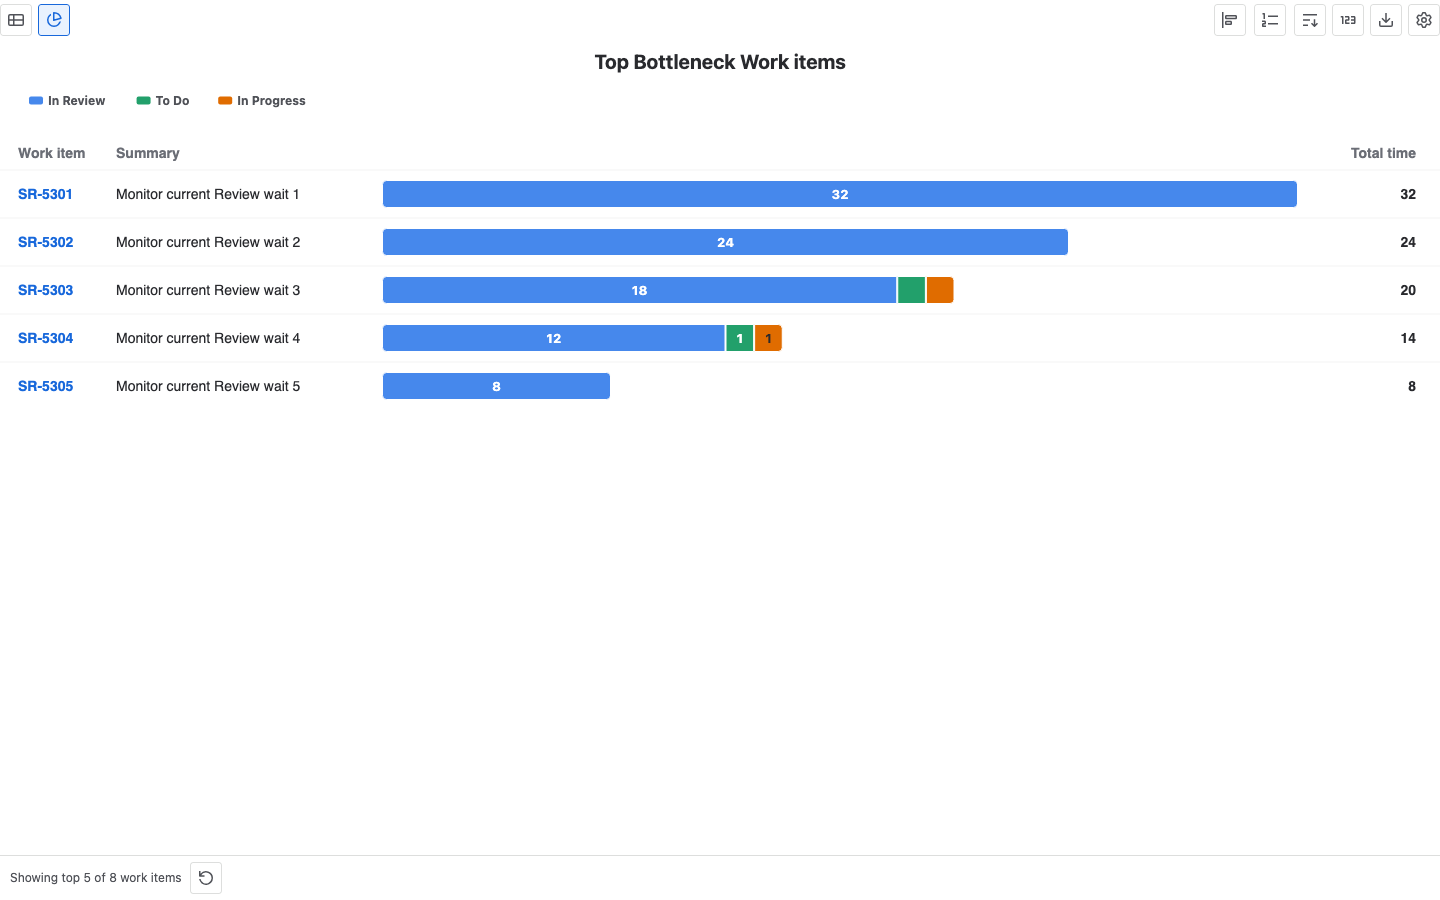
Build the gadget and rerun it consistently
- Open the target Jira dashboard and add the StatusPath Reports gadget.
- Open the gadget’s Settings and select Time in Status.
- Enter the bounded JQL above, then verify that this fixture returns exactly eight rows and that each row is currently In Review.
- Select the UTC weekday Calendar and Decimal Hours Format.
- Keep In Review visible and sort it descending in Table view.
- Switch to Top Bottleneck Work items, set Top N to
5, and sort the chart by In Review. - Save the gadget’s custom configuration. The current edit view saves this
reportConfigwith the Jira dashboard item; it does not select a Saved Report. - At the agreed review cadence, use the visible Refresh action or Jira dashboard refresh and record the observation time before interpreting the result. Either path reruns the current query and calculation.
Record the JQL, history boundary, Calendar, Format, sort field, Top N, and review cadence outside the screenshot. Reapplying those settings makes the calculation definition reproducible; it does not recreate frozen rows or durations from an earlier observation.
Know when to leave the gadget
Stay in the gadget when the question is limited to whether the same compact In Review signal deserves attention at the current check. Move to the main report page when:
- fifth and sixth are tied or close enough that a five-position view hides relevant rows;
- Top 5 membership or concentration changes materially after refresh;
- the signal persists and needs contributor counts, distributions, trends, repeated-entry checks, or a larger table;
- someone asks whether In Review is a systemic bottleneck, why an item is long, or who or what caused the delay.
The current gadget does not provide a Saved Reports menu or a Saved Report selector in edit mode. Navigate separately to the main report page to build or restore a larger investigation workspace, following the reusable-report restore and versioning method. Then inspect representative work items in Jira. Atlassian documents that the work item’s Activity → History records field edits and workflow movements. History and operating context are needed before assigning a cause or changing the workflow.
Common errors
Treating concentration as a bottleneck diagnosis
The 88.68% result says only that five positions contain most of the eight returned In Review duration values at this observation. It does not establish broad accumulation, persistence, capacity constraint, cause, or business impact.
Treating Top 5 as an eight-hour threshold
Top N chooses a number of sorted positions. The fifth value happens to be 8h here; another refresh or population can put a different value in fifth place.
Ignoring a tie at the display boundary
A five-position chart can hide a sixth row with the same duration as the fifth. Treat tied values as equivalent and use the full table for the complete investigation set.
Assuming a timer is configured or the result is frozen
The current release has no configured refresh interval. Use the visible Refresh action or Jira dashboard refresh deliberately. A rerun queries current Jira data and recalculates the report; the gadget stores configuration, not an earlier result snapshot.
Looking for the main page’s Saved Reports menu
The current v2 edit screen saves its own custom report configuration and has no Saved Report selector. Use the main report page when Saved Reports, a larger table, broader chart work, or deeper investigation is required.
Calling accumulated Time in Status active work or current interval age
Time in Status can include repeated visits inside the history boundary, and a long interval can include waiting or other context. It equals the current open In Review interval in this fixture only because each item enters In Review once.
Frequently asked questions
Does the Dashboard Gadget diagnose a Jira workflow bottleneck?
No. It keeps one fixed monitoring definition visible and supplies a concentration signal. A diagnosis needs broader, persistent evidence and representative Jira histories.
Does the Dashboard Gadget refresh automatically?
It responds to Jira dashboard/gadget refresh events, and the footer also has a manual Refresh action. Both rerun the current query and calculation. The current release does not provide a configurable timer interval.
Is Top 5 the same as an eight-hour threshold?
No. Top 5 means the first five positions after sorting by In Review duration. 8h is only the fifth value in this observed eight-row result.
What happens when fifth and sixth are tied?
The chart still displays five positions. Treat the tied rows as the same priority, open the full table, and include all tied rows in the investigation set.
Can this gadget select or freeze a Saved Report?
No in the current v2 edit experience. It saves its own custom reportConfig and exposes neither a Saved Report selector nor the main page’s Saved Reports menu. Later reruns query current Jira data rather than recreating frozen rows.
Related Guides
- How to Find Jira Workflow Bottlenecks
- How to Find Jira Work Items with the Longest Time in Status
- Weekly Jira Workflow Report Example for Management
- Why Current Jira Status Time Keeps Growing
Keep the signal fixed and the diagnosis separate
A useful gadget preserves one monitoring definition, not one frozen answer. Rerun it consistently, interpret Top 5 against the eight-row result, and move to the full report and Jira History when the signal needs explanation. Concentration tells the team where to look next; it does not decide what the workflow problem is.
Try StatusPath Reports on the Atlassian Marketplace to keep one compact Time in Status signal visible on a Jira dashboard.