
How to Compare Average Time in Status Across Jira Teams
Learn how to compare Average Time in Status across Jira teams by aligning scope, Review stages, calendars, and denominators, with a checked 40-item example.
To compare Average Time in Status across Jira teams, first align the work-item population, equivalent Review-stage mapping, history window, calendar, and team-attribution rule. Show each team’s group size alongside the number of work items included in the Review average. A 4.5-hour average based on four work items is a reason to inspect the underlying data, not evidence that the team is faster than an 18-item group averaging 6 hours.
What cross-team averages can—and cannot—tell you
Average Time in Status asks how long work remained in an equivalent Review stage under the same documented calculation rules. It flags differences; it does not rank productivity, quality, or people. This guide covers comparability controls; the Average Time in Status calculation guide covers formulas and repeated entries.
Six controls to align before comparing Jira teams
| Dimension | Record for every team |
|---|---|
| Population | Same work types, completion criteria, period, and exclusions. |
| Review-stage mapping | Exact Jira statuses and documented entry and exit boundaries. |
| History window | Same Trim History rule and reporting cutoff. |
| Calendar | Same timezone, working days, hours, holidays, and exceptions. |
| Team attribution | Grouping field, blank and transfer rules, and current versus historical ownership. |
| Evidence | Group size, Review denominator, row-level spread, and sampled Jira histories. |
Use one duration Format for presentation and checks. Format changes display; Calendar determines counted time.
Review denominator means work items in the Review average—not people or transitions. The UI’s Work item count is group size; verify the denominator in Time in Status.
Important limitation: the current Team value may not represent historical ownership
Current-value grouping can assign pre-transfer history to today’s owner. Define transfers and inspect changed or empty Team values. If historical ownership cannot be rebuilt, publish the limitation; StatusPath is not claimed to rebuild it.
Jira report note: Control Chart and StatusPath averages are different aggregations; see the FAQ before comparing them.
Controlled Jira example: four teams, one Review stage
This 40-work-item example uses a custom single-select Team field—Jira type Select list (single choice)—with values Team Atlas, Team Borealis, Team Cygnus, and Team Delta. It is not Jira’s native Team field, whose grouping is untested. Atlassian lists the field types separately.
The teams use different Jira status names for the same operational Review stage:
| Custom Team value | Jira status used by the team | StatusPath Status Group |
|---|---|---|
| Team Atlas | In Review | Review |
| Team Borealis | Waiting for Review | Review |
| Team Cygnus | In Review | Review |
| Team Delta | Waiting for Review | Review |
Board-column status mapping does not create a StatusPath Status Group. The columns and grouping guide documents how to configure Review from In Review and Waiting for Review in Columns manager.
Controlled history:
2026-07-06 08:00 UTC          created in To Do
1–3 hours later               transitioned to In Progress
after the controlled interval transitioned to the team's Review status
after the listed Review time  transitioned to Done
No Story is reopened; each enters its mapped Review status once, every interval closes, and Team remains unchanged. Group size therefore equals the Review denominator here, not by default.
Manually verify the Average Time in Status values
| Team | Work items in group | Work items included in Review average | Total Review time | Average Review time |
|---|---|---|---|---|
| Team Atlas | 18 | 18 | 108h | 6h |
| Team Borealis | 6 | 6 | 24h | 4h |
| Team Cygnus | 12 | 12 | 60h | 5h |
| Team Delta | 4 | 4 | 18h | 4.5h |
Exact Review durations in hours:
Team Atlas, SR-4301–SR-4318:    3, 4, 4, 5, 5, 5, 5, 6, 6, 6, 6, 6, 6, 7, 7, 8, 8, 11
Team Borealis, SR-4319–SR-4324: 2, 3, 4, 4, 5, 6
Team Cygnus, SR-4325–SR-4336:   2, 3, 4, 4, 5, 5, 5, 5, 6, 6, 7, 8
Team Delta, SR-4337–SR-4340:    3, 4, 5, 6
Team Atlas Review average = 108h ÷ 18 work items = 6h
Team Borealis Review average = 24h ÷ 6 work items = 4h
Team Cygnus Review average = 60h ÷ 12 work items = 5h
Team Delta Review average = 18h ÷ 4 work items = 4.5h
Observed range across team averages = 6h − 4h = 2hCheck the row-level spread
These manual values add context; they are not a significance test or necessarily direct report fields.
| Team | Median Review time | Observed Review range |
|---|---|---|
| Team Atlas | 6h | 3–11h |
| Team Borealis | 4h | 2–6h |
| Team Cygnus | 5h | 2–8h |
| Team Delta | 4.5h | 3–6h |
The arithmetic supports only this statement: under the documented calculation rules, Team Atlas’s Review average is 2 hours higher than Team Borealis’s.
Configure the comparison in StatusPath Reports
- Choose a project, saved filter, or JQL query returning only SR-4301–SR-4340.
- Select
Average Time in Status. - Use
TablesoWork item countand the Review average remain visible. - Group the report by the custom single-select Team field.
- In
Columns manager, create a Review Status Group containing In Review and Waiting for Review. - For this complete-history example, leave
Work item date rangeunset andTrim Historydisabled. See scope and history windows; this is example-specific. - Select custom All time (UTC) (24×7, UTC) and Decimal Hours
Format. The calendar name is not a built-in default. - Run the report and verify:
- Team Atlas: 18 work items and a Review average of 6.00 hours
- Team Borealis: 6 work items and a Review average of 4.00 hours
- Team Cygnus: 12 work items and a Review average of 5.00 hours
- Team Delta: 4 work items and a Review average of 4.50 hours
- Run
Time in Statuswith the same scope and time settings to verify row-level durations and the Review denominator. - Save the verified configuration as a
Saved Report.
A Saved Report preserves configuration, not frozen Jira data. Later changes to work items, fields, permissions, filters, histories, or calendars can alter results.
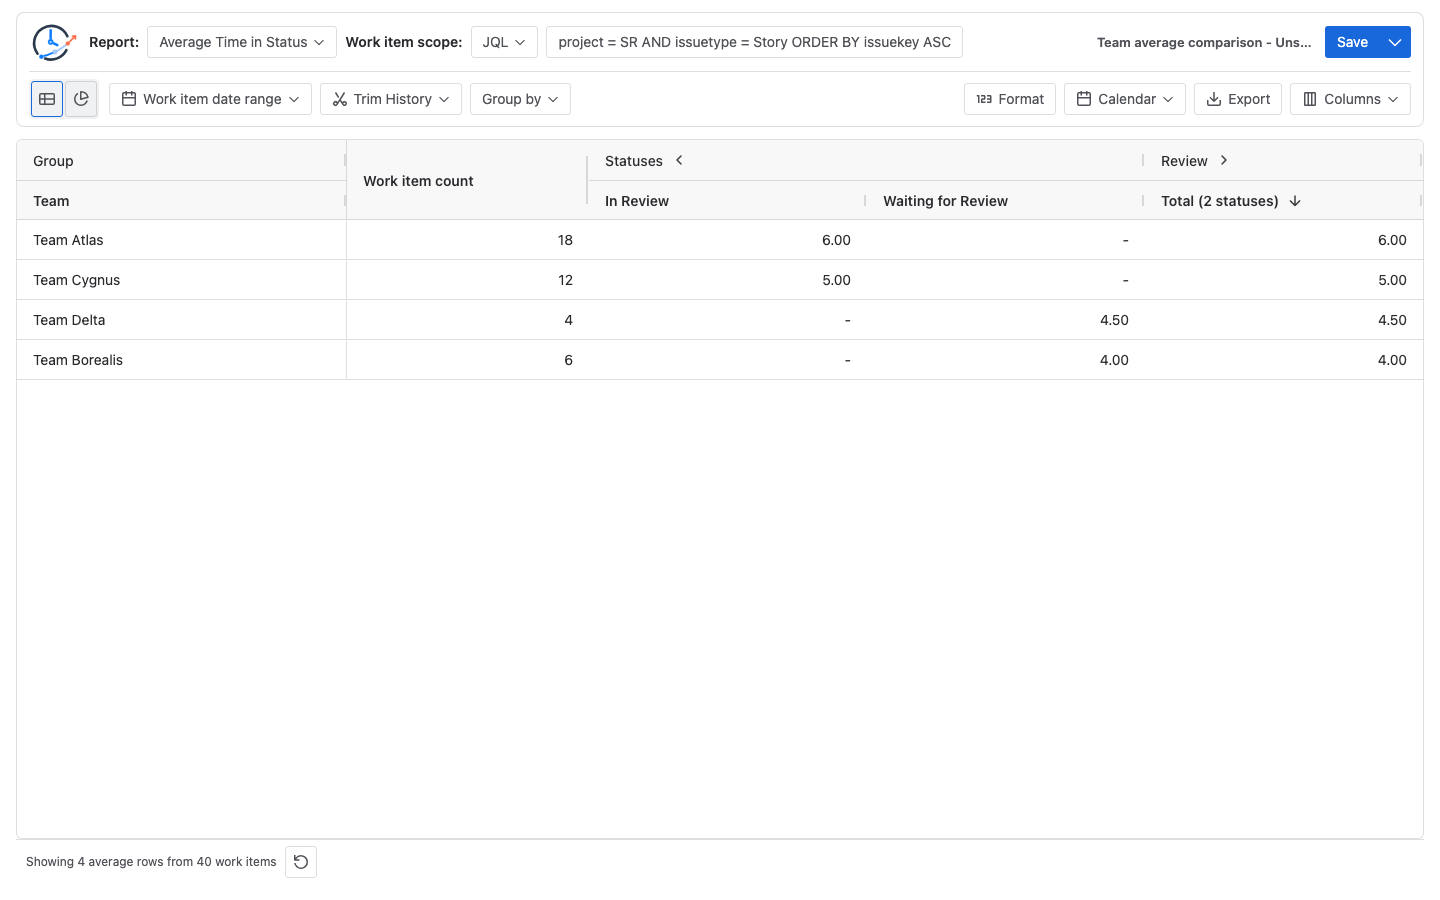
How to interpret the team averages
Keep sample size beside the average
A larger sample is not automatically representative, and a smaller sample is not automatically invalid. One added 10-hour Review Story would raise Team Delta’s average from 4.5 to 5.6 hours: (18h + 10h) ÷ 5. The 2-hour range across team averages is an investigation signal, not proof of productivity or process quality; no significance test is performed.
Confirm the Review denominator
Items that never entered Review are excluded from its denominator. All 40 enter it here, so denominator and group size match.
Confirm equivalent Review boundaries
Matching status names do not prove equivalent boundaries. Confirm Review entry, exit, waiting scope, and transition timing; separate unlike stages.
Use the same calendar definition across teams
Calendar timezone, working days, hours, holidays, and exceptions determine counted time; Format changes display. Jira Working days and StatusPath calendar controls are independent.
Inspect the systems behind the duration
Inspect Jira history and approval systems for short-, medium-, and long-duration items. Status duration measures time between Jira transitions; it proves neither continuous work nor a waiting cause. Use the Jira workflow bottleneck guide for follow-up.
Common comparison mistakes
- Ranking teams from one average: Inspect histories; do not score teams or people.
- Comparing status names instead of stage boundaries: Record Review entry and exit rules.
- Treating group size as the Review denominator: Display and reconcile both counts.
- Matching display Format but not calendar: Align calendar rules before presentation.
- Attributing historical time to the current Team value: Define transfers and disclose missing ownership.
- Mixing open and completed work: Use one inclusion rule and cutoff; open intervals grow.
Frequently asked questions
Does a lower average mean one Jira team is faster?
No. It is lower only for the selected population and rules; inspect sample size, mix, spread, boundaries, and histories.
Must all teams use the same Jira project?
No. A saved filter or JQL can span projects; keep inclusion and attribution comparable.
Can a Status Group normalize different Jira status names?
It can place selected Jira statuses under one Review Status Group. Here each team uses one mapped status; retain the map and verify detail rows.
Is the visible work-item count always the Review denominator?
No. They match here because all 40 Stories entered Review; items that skip it remain in the group count, not its denominator.
Can I compare this result directly with Jira’s Control Chart?
Not directly. Atlassian’s Control Chart documentation applies to company-managed spaces; confirm availability elsewhere. Selected statuses set its cycle-time range; average, rolling average, and standard deviation are distinct. Board-column mapping creates no StatusPath Status Group, and Jira Working days are separate from the StatusPath calendar. Align population, boundaries, window, working-time rules, open/completed treatment, and aggregation. A Jira rolling average is not the same metric as an Average Time in Status value for a Status Group in StatusPath Reports.
Related guides
- How Is Average Time in Status Calculated in Jira?
- Jira Business Calendars for Workflow Reporting
- How to Find Jira Workflow Bottlenecks
- How to Calculate Time in Status in Jira Cloud
Turn the result into an auditable question
Keep population, Review mapping, history window, calendar, group size, and denominator with each average. Inspect items before changing workflow or staffing.
Try BlueGrove Labs’ StatusPath Reports - Time in Status for Jira on Atlassian Marketplace. Reuse the Team field, Review Status Group, and calendar. Keep the StatusPath Reports documentation and BlueGrove Labs support with the configuration; the report does not explain delays, evaluate people, or rank teams.