
How to Find the Work Items Behind Jira Average Time in Status
Drill from a grouped Jira Average Time in Status value to its participating work items, verify the contributor math, and inspect one item’s complete status journey.
To find the work items behind a grouped Jira Average Time in Status value in StatusPath Reports 2.5, use the action in that group’s Work item count cell. The first drill-down lists the participating work items and their status contributions. From there, open the action beside one work item to compare its selected group contribution with its full Status timeline and History path.
15-minute evaluator path
Use one small Jira scope: run Average Time in Status in Report Center, open one group’s Work item count, inspect one contributor’s Journey, then tell us what was clear, confusing, or missing.
Why an average needs a work-item drill-down
An average can tell you that one group is slower than another, but it cannot explain the distribution by itself. One unusually long work item may lift the average, several moderate delays may create the same value, or some work items in the group may never have contributed to the selected status.
Atlassian’s Time in current status dashboard template similarly presents an average together with work-item counts and a details table. That native template answers a different question: it covers open work items in their current statuses, uses rounded days, and does not show past statuses. The shared analysis principle is that a summary metric becomes more useful when the underlying work items remain inspectable.
Atlassian’s Control Chart guidance also notes that outliers can skew an average and may need investigation. A Control Chart’s cycle or lead time is not the same metric as a grouped per-status average in StatusPath. Use the report that matches your question, then inspect the work items behind the result instead of treating the mean as a diagnosis.
Start from a grouped Average Time in Status report
Run Average Time in Status in Report Center and choose the Jira population, date boundaries, Calendar, duration Format, statuses, and Group by field that define the question. In this example, nine work items are grouped by Work item type.
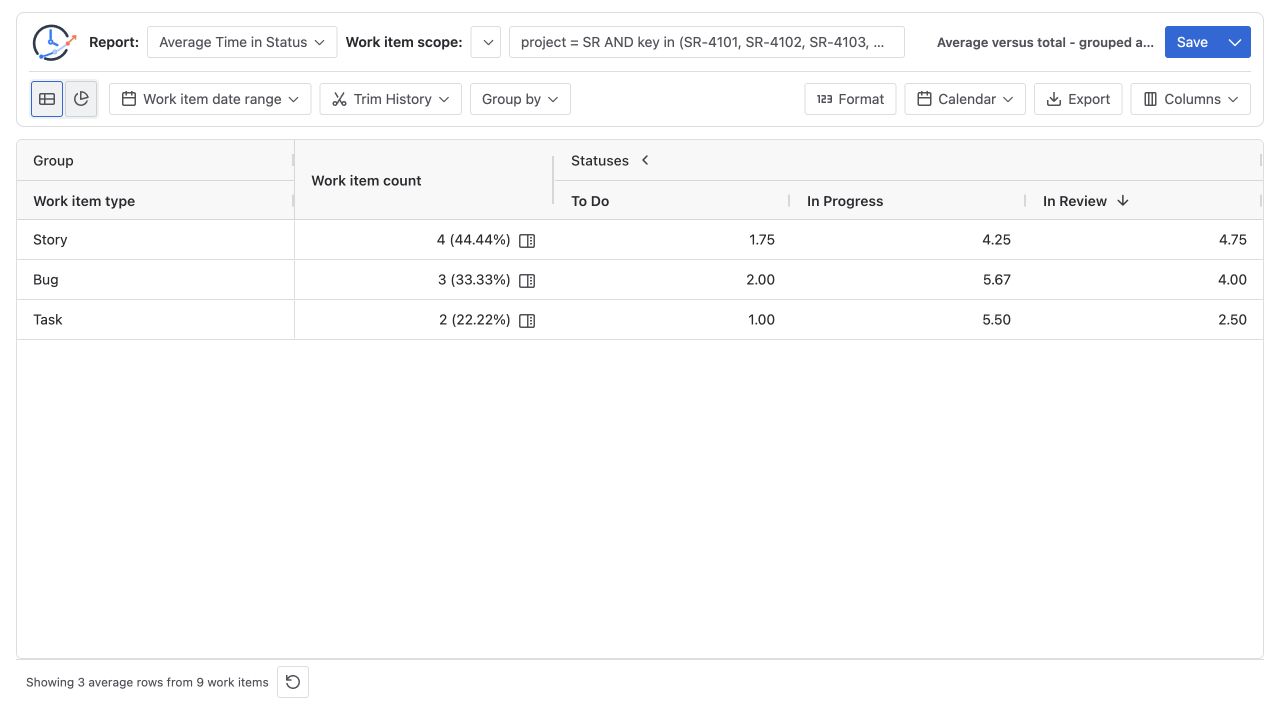
The Story row shows 4 (44.44%). The count means that four distinct work items participate in that group. The percentage compares those four with the nine-work-item report population.
Click the action beside 4 (44.44%), not the 4.75 average cell. The Average status duration details view opens with the selected group, participating count, work item keys, summaries, and each item’s calculated status contributions.
Recalculate the displayed average from its contributors
The Story participants in the example contribute these In Review values:
| Work item | In Review contribution |
|---|---|
| SR-4101 | 1.00h |
| SR-4104 | 3.00h |
| SR-4107 | 5.00h |
| SR-4109 | 10.00h |
The grouped value is reproducible:
(1.00h + 3.00h + 5.00h + 10.00h) ÷ 4 contributors = 4.75h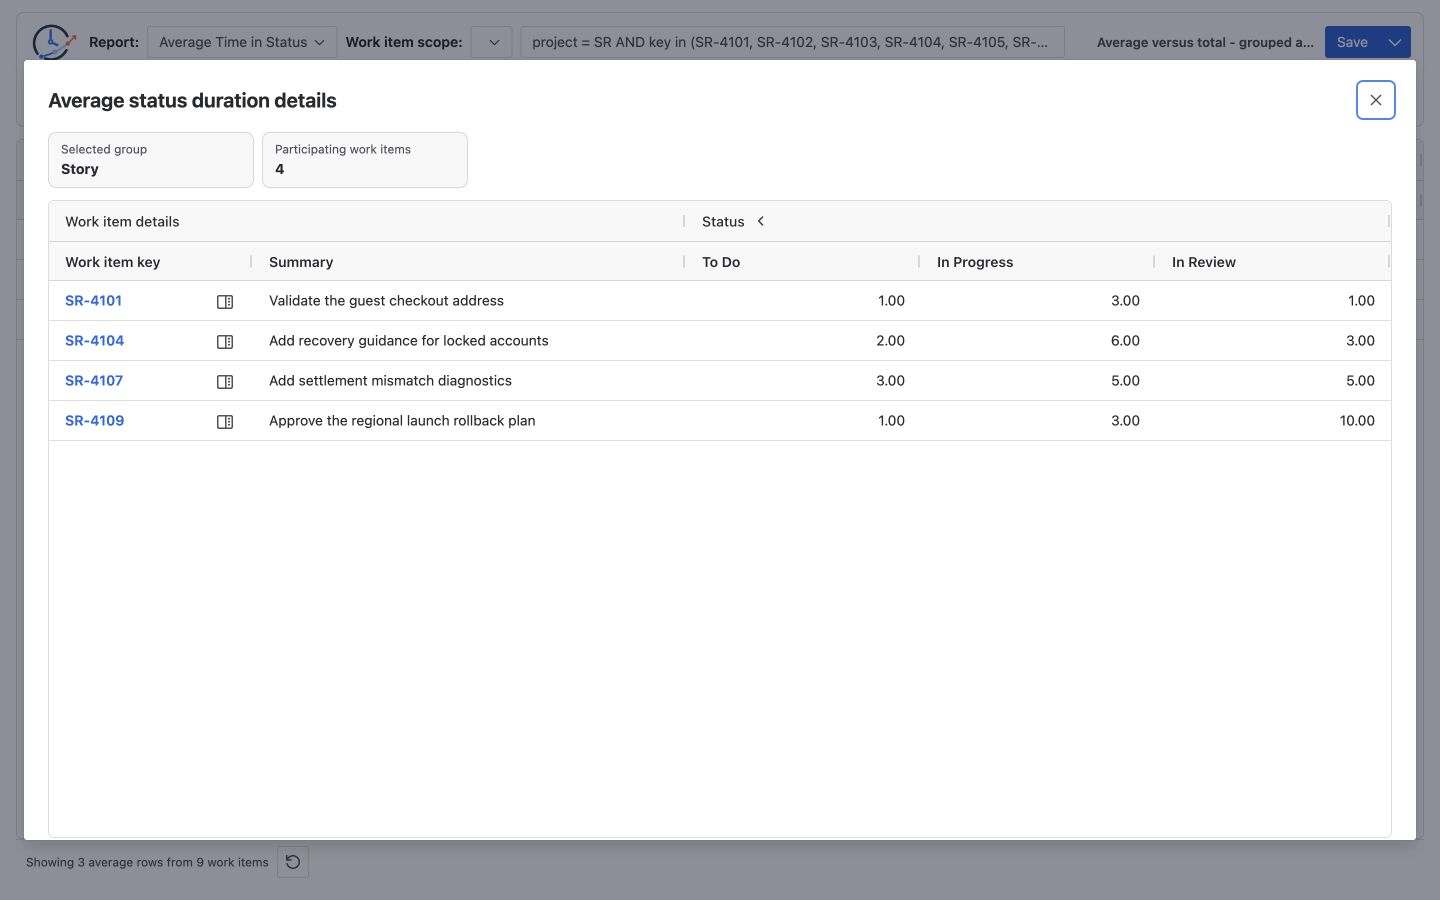
This table separates two questions that a single average cannot answer:
- Which work items belong to the group? The participating list answers this for the row you opened.
- Which work items contribute to one status average? Values in that status column and its denominator explain the metric.
The group’s Work item count is not guaranteed to equal every status denominator. If four Story work items are in the group but one never enters In Review, the group count remains four while the In Review average uses only the three qualifying contributors. A work item with a real zero-duration contribution is different from a work item with no contribution.
Open one contributor’s Status Journey
Use the status-journey action beside a participating work item. In Report Center, the nested view includes the work item identity, Selected group contribution cards, Status timeline, and History path.
Read the two boundaries separately:
| View | What it answers |
|---|---|
| Selected group contribution | How this work item contributed to the Average group under the report’s selected statuses, Calendar, time bucket, and Trim History settings. |
| Status timeline | Which status intervals are present in the accessible full history up to report generation, including entry and exit times and an actor when Jira supplies one. |
| History path | Which statuses and directed transitions form the complete workflow route, including repeated visits and loops. |
FULL HISTORY does not apply the report’s Trim History start or end. Therefore, a full-history status total may be longer than the selected group contribution. Use the contribution cards and participant table to reconcile the aggregate; use Status timeline and History path to investigate lifecycle context.
A practical investigation sequence
- Freeze the report question. Record the Jira source, date boundaries, Trim History, Calendar, Format, grouping field, and selected statuses.
- Compare groups. Identify the group and status combination that merits inspection, but do not call it a root cause yet.
- Open Work item count. Confirm the participating work items and the group percentage.
- Recalculate one average. Sum the visible status contributions and divide by that status’s qualifying contributor count.
- Sort or scan the participant values. Find a high contributor, a typical contributor, and any blank or zero-looking case.
- Open one Status Journey. Compare selected contribution with full history and review repeated statuses or transitions.
- Verify decisive changes in Jira History. The report helps locate evidence; Jira remains the source record for the underlying status changes.
Boundaries to keep explicit
Work item count is not always a status denominator
The group count includes distinct work items in the row. A status average includes only the work items that produced a qualifying contribution for that status under the current calculation.
Percentages can exceed 100% across rows
When Group by uses a multi-value Jira field, one work item can participate in more than one group row. Each row still deduplicates that work item internally, but percentages across overlapping rows can add to more than 100%.
The participant list is snapshot-backed
The first drill-down uses the retained report result. Jira changes made after the report run do not automatically change an already opened participant list. Run or refresh the report before an investigation that requires current Jira data.
The nested journey performs a separate current load
Opening a participant’s journey reads that one work item and its accessible changelog. Permissions, issue security, a changed work item, or unavailable changelog pages can make the journey differ from or become unavailable after the participant snapshot was created.
Drill-down is evidence, not an automatic diagnosis
The current report does not calculate median, P85, or a statistical outlier threshold, and it does not infer why a delay happened. Use the individual values, workflow path, Jira History, and team context to test a cause.
Use this path in Report Center
The aggregate-to-participant-to-journey path described above is available in Report Center. Start from the Work item count action in an Average Time in Status table. Do not look for the same entry point in a Time in Status row, Dashboard Gadget, or Issue Activity.
Frequently asked questions
Where is the drill-down action?
In a grouped Average Time in Status table, find the Work item count cell and use the action beside its count and percentage. The average duration cell itself is not the first-level trigger.
Why does Work item count differ from the average denominator?
Some group members may not have a qualifying contribution to the selected status. Check that status column in the participant table and its denominator context.
Why is Full history longer than the selected contribution?
The report may use Trim History or a date bucket, while Status timeline and History path show full accessible history up to report generation.
Does the drill-down prove the root cause of a delay?
No. It identifies the work items, status contributions, intervals, and transitions worth investigating. Validate the decisive events in Jira History and with the team.
Can I use this path in Issue Activity or Dashboard Gadget?
No. Use Report Center for the supported Average group → participating work items → one work item Journey path. Issue Activity analyzes the current work item, and Dashboard Gadget provides a compact report surface; neither exposes this Report Center drill-down path.
Related Guides and documentation
- How Is Average Time in Status Calculated in Jira?
- Average vs Total Time in Status in Jira
- How to Find Jira Work Items with the Longest Time in Status
- Issue Drill-down and Work Item Status Journey
- Report setup and scope
Move from the average to the evidence
Run an Average Time in Status report, open one group’s Work item count, recalculate a status average from the participant values, and inspect one contributor’s Status Journey. Try StatusPath Reports on the Atlassian Marketplace to follow the 2.5 drill-down path with your own Jira scope.